BCH from a SMART MONEY point of viewAccording to the reviews we have had on the chart, we have determined the high and low liquidity pools.
The liquidity pools of the upper area have been swept and candles have hit SUPPLY. Now there are two TPs ahead of the price.
We have liquidity pools in the lower areas.
To achieve TP 2, it is necessary to break the range of TP 1. TP 2 range is a suitable place for buy/long positions
BCH

it's time to going up for BCHUSDTbefore buying, please check for being sure about your opinion about this CRYPTOCURRENCY!!!
(in every target you want, closed the position but our target is the third one)
*Guy's the entry place is importance things in enter in a position and be careful do not going up your leverage over 7x ,all things it's about risk management*
*************************************************
if you want to enter in this position:
Enter Price:
Target1: 259.98
Target2: 264.51
Target3(Final Target): 268.14
Stoploss: 251.35
*************************************************
Guy's if this idea was useful and it was intresting for you please follow for more
please do comment and like my idea
If you like my idea show me in comment section
doing and living in the best quality
thanks of all of you dear's ;)

Breakout & Re-test of ~5.5 year Falling WedgeBitcoin Cash was in a falling wedge for nearly five and a half years before it broke out of it back in June of 2023. Presently, it is re-testing the top of a dashed-line wedge drawn from wick to wick and has failed to reach the top of the solid wedge drawn from the line chart.
Holding above the wedge could lead to an approx 5.25x move against Bitcoin from its current position at 0.0057 to TP 1 at 0.030 and an 11.75x move should it reach TP 2 at 0.067.
It's possible we could see a double-bottom with a slightly higher low around 0.0041 or 0.0040 if it re-tests the solid wedge's top over the next weeks or into March or June, before moving up towards targets.
Should a wedge re-test and double-bottom occur first, the possibility for already major gains vs. Bitcoin increases to 7.3-7.5x at TP 1 or 16.34-16.75x at TP 2.

BCH: Pullback in UptrendBitcoin Cash (BCH) technical analysis:
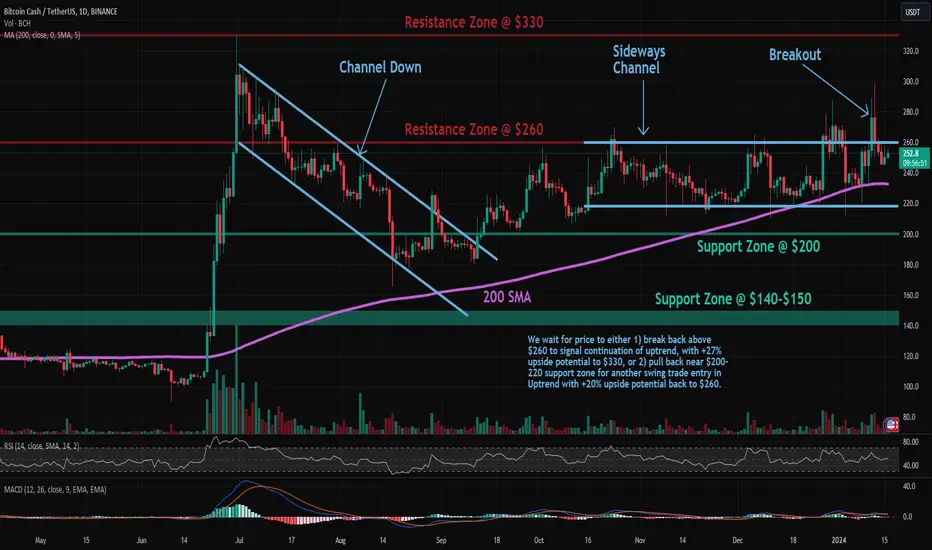
Trade setup : Price is in an uptrend. Following a bullish breakout from Sideways Channel ($218 – $260), above $260 resistance, price rallied 20% to $300, then pulled back to retest that breakout level. Now we wait for price to either 1) break back above $260 to signal continuation of uptrend, with +27% upside potential to $330, or 2) pull back near $200-220 support zone for another swing trade entry in Uptrend with +20% upside potential back to $260.
Trend : Uptrend across all time horizons (Short- Medium- and Long-Term).
Momentum is Mixed as MACD Line is below MACD Signal Line (Bearish) but RSI ~ 50 (Neutral).
Support and Resistance : Nearest Support Zone is $200 (previous resistance), then $140 – $150. The nearest Resistance Zone is $260, then $330.
BCH tradeNYSE:BCH update...
#BCH filled the last 15m FVG Lets see if it holds this time... PP at previous high...
#trading #BitcoinCash

BCH: Sideways Channel BreakoutTrade setup : Bullish breakout from Sideways Channel ($218 - $260), above $260 resistance, signals resumption of uptrend, with upside to $330 next. Stop Loss (SL) at $250 (just below breakout level).
Pattern : Price was trading in a Sideways Channel , which is a neutral pattern (indication of market indecision). Trend Traders ought to wait for a breakout in either direction, although typically it breaks in the direction of the existing trend. Swing Traders can trade the range – Buy near Support and Sell near Resistance.
Trend : Uptrend across all time horizons (Short- Medium- and Long-Term).
Momentum is Bullish (MACD Line is above MACD Signal Line and RSI is above 55).
Support and Resistance : Nearest Support Zone is $200 (previous resistance), then $140 - $150. The nearest Resistance Zone is $260, which it broke, then $330.

CAN BCH NEW VOLUME GAIN $300?Thanks for reading this updat.
BCH seems to have a new volume what can get new confirmation in the coming peroids.
This updates depending on day trade, And the market should confirm with time the right market way.
#Nottradingadvice
#For day traders take always profits when market increase
#Expect noting from the markets, but follow what it shows.

BCHUSDTBINANCE:BCHUSDT Short idea
⛔"Daily crypto market analyses I provide are personal opinions & not financial advice. Trading carries risks, so do your own research & seek advisor's help. #DYOR
Don't forget to 🚀 and comment

BCH update [ MAJOR LIQUIDATION]At the moment, price is still retesting the current midvwap, but as soon as price break below 215$, sells towards 150$ come in play. On the other hand, price can still retest the current high at around 260$, but only if price manages to break above 290$ we shall start looking for buys continuation. Until then sells are more valid than buys, simply because liquidity has to be mitigated first.

BCHUSDT Supply Zone Break & Sustained Bullish PhaseSince June 2023, Bitcoin Cash experienced a significant shift from bearish to bullish sentiment following its breakout above the crucial supply zone. The subsequent re-test of this zone turned it into a support/demand area.
Notably, the most recent clean rejection at the 50% Fibonacci level during a yesterdays' dump underscores buyer interest at this price point. This supports the active bullish phase, increasing the probability of a continued long-term uptrend.
With attention drawn to two key resistance areas at $433 and $574, there's a potential upside of 110-175% for BCHUSDT in the coming month or two.

BCH ANALYSIS (1D)According to the BCH chart, it looks like a flat pattern has ended with a terminal c.
Another bullish wave should emerge. The price targets are clear on the image.
Fixing a daily candle below the green range will violate the analysis.
For risk management, please don't forget stop loss and capital management
When we reach the first target, save some profit and then change the stop to entry
Comment if you have any questions
Thank You

BCH: Sideways ChannelTrade setup : Trends are mixed and price is trading in a Sideways Channel ($218 - $260). Swing Traders can trade the range – Enter near Support ($218) and Exit near Resistance ($260). Trend Traders ought to wait for a breakout in either direction. If it’s able to break above $260 resistance, it could resume its uptrend and revisit $330 level from July.
Pattern : Price is trading in a Sideways Channel , which is a neutral pattern (indication of market indecision). Trend Traders ought to wait for a breakout in either direction, although typically it breaks in the direction of the existing trend. Swing Traders can trade the range – Buy near Support and Sell near Resistance.
Trend : Downtrend on Short-Term basis, Neutral on Medium-Term basis and Uptrend on Long-Term basis.
Momentum is Mixed as MACD Line is below MACD Signal Line (Bearish) but RSI ~ 50 (Neutral).
Support and Resistance : Nearest Support Zone is $200 (previous resistance), then $140 - $150. The nearest Resistance Zone is $260, then $330.

BCH Pump is Loading BCH Pump is Loading
After the last Breakout its still in another downtrend weekly trend if it breakout 2 X from here is very likely , keep an eye on it

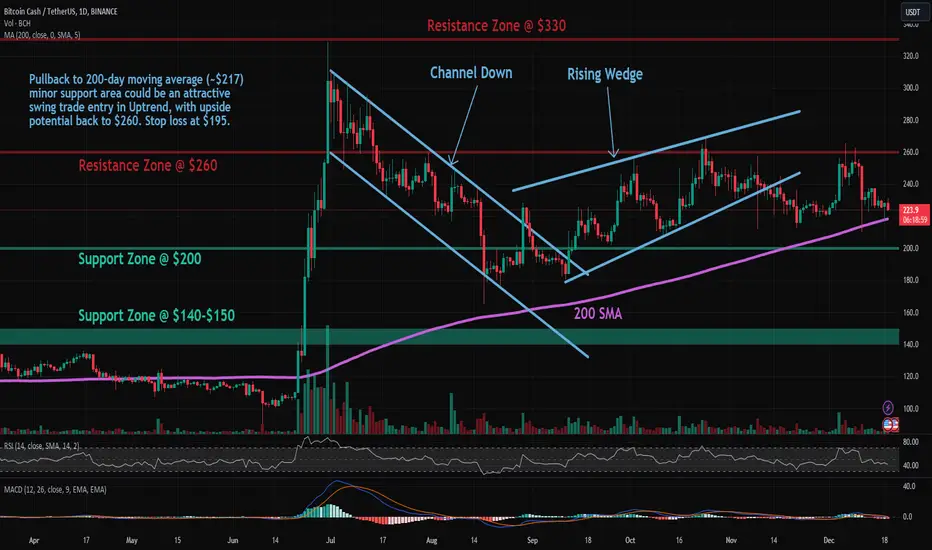
BCH: Pullback in UptrendTrade setup : Price remains in an Uptrend. Pullback to 200-day moving average (~$217) minor support area could be an attractive swing trade entry in Uptrend, with upside potential back to $260. Stop loss at $195. Price has been rejected near $260 resistance zone several times in the last three months, making this a critical level. If it’s able to break above $260 resistance, it could resume its uptrend and revisit $330 level from July.
Trend : Downtrend on Short-Term basis and Uptrend on Medium- and Long-Term basis.
Momentum is Bearish (MACD Line is below MACD Signal Line, and RSI is below 45).
Support and Resistance : Nearest Support Zone is $200 (previous resistance), then $140 - $150. The nearest Resistance Zone is $260, then $330.
BCH: Approaching ResistanceTrade setup : Price remains in an Uptrend, trading above 200-day moving average. However, it’s been rejected near $250 resistance zone several times in Oct and Nov. If it’s able to break above $250 resistance, it could resume its uptrend and revisit $330 level from July.
Trend : Uptrend across all time horizons (Short- Medium- and Long-Term).
Momentum is Mixed as MACD Line is below MACD Signal Line (Bearish) but RSI ~ 50 (Neutral).
Support and Resistance : Nearest Support Zone is $200 (previous resistance), then $140 - $150. The nearest Resistance Zone is $250, then $330.


BCH: Approaching ResistanceBitcoin Cash (BCH) technical analysis:
Trade setup : Price remains in an Uptrend, trading above 200-day moving average. However, it’s been rejected near $250 resistance zone several times in Oct and Nov. If it’s able to break above $250 resistance, it could resume its uptrend and revisit $330 level from July.
Trend : Uptrend across all time horizons (Short- Medium- and Long-Term).
Momentum is Bullish (MACD Line is above MACD Signal Line and RSI is above 55).
Support and Resistance : Nearest Support Zone is $200 (previous resistance), then $140 – $150. The nearest Resistance Zone is $250, then $330.

Potential Surge to $305Bitcoin Cash is showing signs of an upward movement as it follows an uptrend line, hinting at a possible increase in its value shortly. For traders, it's wise to monitor the situation and wait for a daily candlestick to close above this uptrend line before making any trading decisions.
If this occurs, BCH could potentially target the key resistance area near $305.
This analysis is for informational purposes only and should not be considered as financial advice.

BCH is ready for a jumpThe strength of the bearers has been taken and the downtrend has weakened
A triggerline has been established and we have also had a bullish CH and orders have been received from the DEMAND zone.
Price is ready to move towards TP.
For risk management, please don't forget stop loss and capital management
Comment if you have any questions
Thank You

BCH/USDT Broke Out of a Descending Channel | 🚀👀 What's Next?💎 Paradisers, get ready for a promising trading opportunity with BCHUSDT. The asset is currently making significant moves in the demand zone, suggesting a potential shift towards an upward trend.
💎 BitcoinCash has been diligently following a descending channel. Its recent breakout from this channel suggests an upward move towards a resistance level, likely to be followed by a rapid pullback, aligning with its usual market pattern.
💎 There's a strong chance of a bullish trend starting from the support level at around $235. Having effectively broken out of the descending channel, BCH is now targeting resistance levels near $305.
💎 Timely decision-making is key for astute Paradisers. Pinpointing the most advantageous entry points during this upward trend is crucial, and it's wise to exercise caution to avoid entering at the height of the trend.
💎 Remain vigilant, as there is also a risk of BCH falling below the support level of $212. A decline below this important threshold could cast doubt on the sustainability of the upward trend.

BCH: Rising Wedge BreakoutBitcoin Cash (BCH) technical analysis:
Trade setup : Bearish breakout from a Rising Wedge pattern, could lead to a pullback to $200 support area (and 200-day moving average) in the near-term, which could be an attractive swing trade entry, with upside potential back to $250.
Pattern : Rising Wedge It usually forms after an uptrend and suggests a potential bearish reversal in the original uptrend. When price breaks the lower trend line the price is expected to trend lower.
Trend : Neutral on Medium-Term basis and Uptrend on Short- and Long-Term basis.
Momentum is Mixed as MACD Line is above MACD Signal Line (Bullish) but RSI ~ 50 (Neutral).
Support and Resistance : Nearest Support Zone is $200 (previous resistance), then $140 – $150. The nearest Resistance Zone is $250, then $330.

BCH: Rising Wedge BreakoutBitcoin Cash (BCH) technical analysis:
Trade setup : Bearish breakout from a Rising Wedge pattern, could lead to a pullback to $200 support area (and 200-day moving average) in the near-term, which could be an attractive swing trade entry, with upside potential back to $250.
Patterns : Rising Wedge It usually forms after an uptrend and suggests a potential bearish reversal in the original uptrend. When price breaks the lower trend line the price is expected to trend lower.
Trend : Downtrend on Short-Term basis, Neutral on Medium-Term basis and Uptrend on Long-Term basis.
Momentum is Bearish but inflecting. MACD Line is below MACD Signal Line and RSI is below 45 but momentum may have bottomed since MACD Histogram bars are rising, which suggests that momentum could be nearing another upswing.
Support and Resistance : Nearest Support Zone is $200 (previous resistance), then $140 – $150. The nearest Resistance Zone is $250, then $330.

BCHUSDT Forms Prominent Triangle on Daily ChartCurrently Bitcoin Cash KRAKEN:BCHUSDT market is undergoing consolidation near the crucial support line of the triangle, setting the stage for potential movement in the coming days.
💜 If you appreciate our charts, support us with boost button 💜
Technical Insights:
Pattern Formation: The development of a large triangle formation suggests a period of indecision and potential market coiling.
Support Consolidation: The present consolidation near the support line within the triangle signifies a critical juncture for market participants.
Anticipated Rebound: The upcoming days could unveil a noteworthy rebound to the upside, fueled by the dynamics of the triangle pattern.
Key Levels Within the Triangle:
Support Zone: The support line within the triangle is prominently situated at $222, acting as a crucial level for market stability.
Resistance Zone: Positioned at $247, the resistance within the triangle marks a pivotal barrier that the market must contend with.
Strategic Considerations:
Observing the Triangle: Keep a vigilant eye on the ongoing consolidation within the triangle as it often precedes significant price movements.
Reversal Potential: The bounce from the support line presents an opportunity for a bullish reversal, with the $247 resistance level serving as a target.
Stay tuned for potential breakout or breakdown scenarios. The $222 support and $247 resistance levels will likely play pivotal roles in determining the next phase of Bitcoin Cash's price action.
Happy trading!
