BITCOIN CASH - I like the chart💚💙High reward vsd risk ratio, I am loving this chart and entering with care.
Bchusdlong

BCH reached strong resistance - BCH/USD entry levels - LONGBCH rocket was launched a little bit later than on BTC, but it is here. We reached an important resistance around $632. We are heading for a correction, but Bitcoin Cash is still bullish. You have several options to jump in.
ENTRY LEVELS BCH/USD LONG:
$532
$497
$466
If we break the price of $632, buy with a pullback but be careful.


BCHUSDT formed bullish BAT | Upto 38% move expectedOn the daily chart, the price action of Bitcoin Cash has completed bullish BAT pattern, now it has entered in the potential reversal zone. There are also 100 and 200 simple moving averages supports in the potential reversal zone.
Buying And Sell Targets:
The buying and sell targets according to harmonic BAT pattern should be:
Potential reversal or buying zone: $262.77 to $248.88
Fibonacci projection or sell zone: $295.91 to $345.57
Stop Loss:
The potential reversal zone area that is up to $248.88 can be used as stop loss in case of complete candlestick closes below this level.
Possible profit and loss ratio:
As per above targets this trade has a profit possibility of 38.8% and as per the above-mentioned stop loss, the loss possibility is 6%.
Note: Above idea is for educational purpose only.

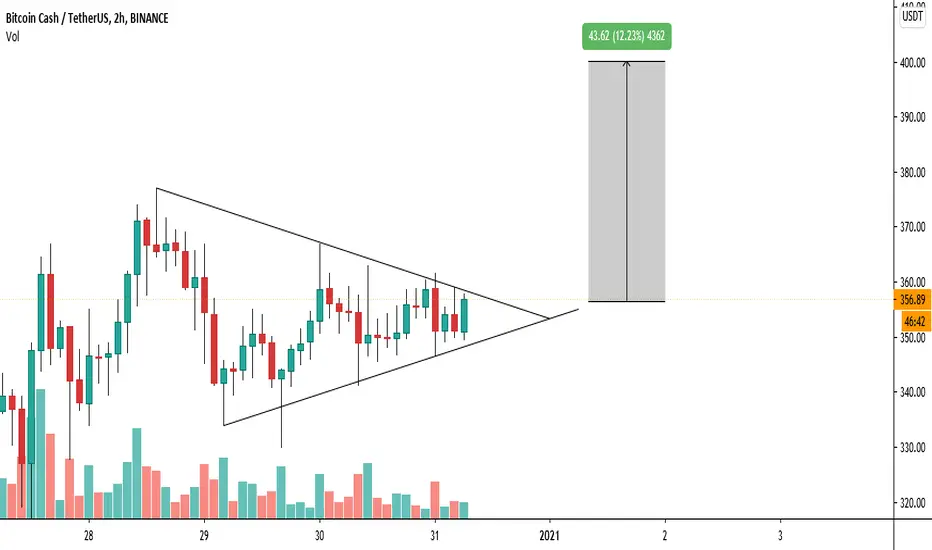
Bitcoin cash symmetrical traingleBCH / USDT
🌟 Techincal Analysis🌟
The price was Consolidating last days and
Forming symmetrical traingle
The Higher chance it will break it up
Why ? Because
most tether coins moved recently but bitcoin cash not
If breakout upward happens iam sure we can see BCH trading in 3xx$ area easy
However break it down then we can see 220-200$ area ( strongest support )and i dont think that will happen unless btc dump (hard)
Please have a plan before trading
Good luck and happy trading 🌹

Updates: Bitcoin Cash show change of trend!!!In H1 we see that Bitcoin Cash turn bullish!!!
In H4 timframe we see that expectative is so bullish!!!
Waoh, we see a good bought opportunity in this par!!!
So, I put a buy order limit at $248 USD with a SL at $242 USD.

Bitcoin Cash show a bought opportunity!!!Hello traders, As many traders commented the idea on Bitcoin Cash, well, I see that Bitcoin Cash is support in the key support and we see another bought opportunity trade in this strategy called supply and demand. Also, in the previously technical analysis, I mentioend that Bitcoi Cash is formed a double top and it's completely formed and my prediciton was very right in the exact target $240 USD. Remember that I trade Ethereum and I hope a Bitcoin entry in long toward the $17,000 USD. Now, in Bitcoin Cash we see another interesting opportunity in this trade. I hope that Bitcoin Cash in H4 formed a species of double top to validate this yellow zone and this support key with a confirmation o price action in H1 timeframe. We hope that situation or Bitcoin Cash.
And also as in the pass we see a double top, I draw a simetric triangle in Daily becuase in weekly I remember that I make a technical analysis that we can to see bought on the 0.618% o Fibonacci in weekly timeframe for Bitcoin Cash.
We hope that this opportunity get profits and we hope an entry!!!
I add my previously technical analysis on Bitcoin Cash for you!!!


BITCOIN CASH 💣Hello, friends!!!🧡
Just quick overview on Litecoin 🧐
Thank you for attention!😊
Stay in touch with me💋
Always sincere with You🧡
Your Rocket Bomb🚀💣

BCHBTCFirst support is no more support. Looks like free fall.
Building a position here, bcs my experience with BCH is that always he pumps hard, and above all tops.
So...
0.021-2 entry
Sl below @ 0.02-0.019
First tp1 is @ 0.027
I will long hold this position, or maybe even upgrade it if price fall.


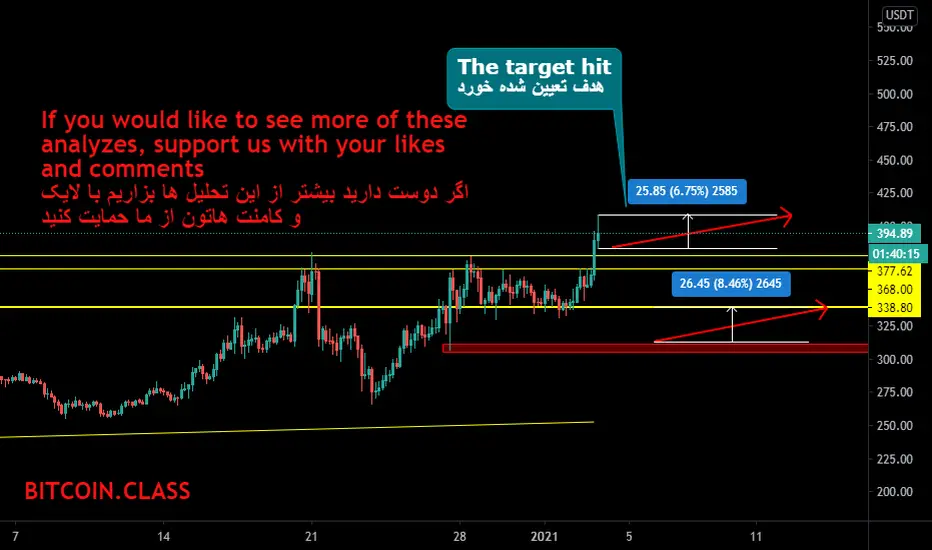
Bitcoin cash $400 ... if btc doesnt dumppattern playing out nicely on bitcoin cash if we break the highs expect a very nice impulse

Inverted Head&Shoulders on BCHBTCHello, traders.
BCHBTC is forming a possible inverted head and shoulders on an important support level on 15 minutes intraday timeframe.
Attention: The entry point is only after the breakout of the neckline. The stop-loss must go below the last bottom and, the objective is on the next important resistance level.
The blue line is another excellent entry point for this asset.


First Long Entry Position BCHUSDTFirst Long Entry Position BCHUSDT
we will wait for next buy position unless close sign candle appears...

BCH/USD 60min long.
####### BCH/USD Technical Analysis - 240m - July 24 #######
#####################################################
~ Active Trend : BULLISH
~ Background Trend : STRONGLY BULLISH
~ Technical Indicators : 50% Bullish, 11% Bearish, 39% Neutral
~ Weights : RSI and CCI bearish Divergence, $5m market Sell order BTC
~ Targets : 242, 260
--------------------------------------------------------------------------------
Sentimental Analysis
The basic bullish trend is very strong on BITCOIN CASH - BCH/USD but the short term shows some signs of running out of steam. However, a purchase could be considered as long as the price remains above 232.50 USD. Crossing the first resistance at 242.49 USD would be a sign of a potential new surge in the price. Buyers would then use the next resistance located at 260.26 USD as an objective. Crossing it would then enable buyers to target 308.22 USD. Caution, a return to below 232.50 USD would be a sign of a consolidation phase in the short-term basic trend. If this is the case, remember that trading against the trend may be riskier. It would seem more appropriate to wait for a signal indicating reversal of the trend.


