BCH has real potential to EXPLODE higher . This is on watch MartyBoots here . I've been trading for 13 years and just sharing my views with the crypto community
Have a watch and u will see why this can explode higher
Bchusdlong

Bitcoin Cash: Analysis using Ichimoku 23/06/2020H4
On D1, the price fluctuates around the cloud. The triangle model of correction is visually clearly visible.
Conclusion:
Locally, we recommend selling when the RSI reaches an oversold level on the H4 and when the price will reach to the Fibonacci level of 36.8% and 23.6%.
H1
At H4, the cloud is directing upward, indicating an uptrend. At H1, the cloud is directing upward, indicating the movement within the framework of the trend for H4.
Conclusion:
Locally, we recommend buying from the Ichimoku cloud. As a result, the RSI may form a divergence, which will be confirmation for lower of the price on H4.
Good luck!

BCHUSD | A Downward Correction Rally Before Bullish MoveHi friends hope you are doing good and welcome to the new update of Bitcoin cash. After the strong best trend that was started from Feb to March 2020. The price action of the BCH completed the final bearish leg of bullish Shark pattern on the 4 day chart. And on 19th March I posted an idea on this move of Bitcoin cash. I predicted as per Fibonacci sequence of this bullish Shark the price action should move up and enter in the Fibonacci projection area of C to D leg from 0.382 to 0.786 Fib projection. And finally after mid of March the price action moved up and as per prediction it entered in this Fibonacci projection area. And so far it has produced more than 56% bullish rally.
Wedge formation and moon phases are giving bearish signals:
Now on the daily chart the price action of Bitcoin cash is moving in a wedge since March 2020. The Bitcoin cash has several touches at the support and the price action has also made several attempts for the breakout. But so far the BCH is not able to break out the resistance of this wedge. Here I have placed the moon phases indicator. On upside you can watch the full moon and on the downside the dark moon can be seen. The distance between one full moon to another full moon and from one dark moon to other dark moon is called synodic cycle that is 29.5 days long. Now after the completion of the recent synodic cycle we can see that the new full moon was appeared down than the previous full moon. And the new full moon is inside the wedge below the resistance. And the recent dark moon was appeared below the support and it down than the previous dark moon. So here the moon phases indicator is giving the bearish signal and indicating that the price action might be moved down from here. Moreover I've also placed bollinger bands indicator and we can see that the upper bands of the bollinger bands is below the resistance of the wedge pattern and the price action is not able to cross up the resistance of bollinger bands and can start another downward move up to the suppor. here I have also implemented the volume profile indicator on the complete price action moving within this pattern that is showing that trader’s interest is strong up to the support that is around $225. Therefore a possible move up to the support is expected. However we take a look at volume indicator then even though there is not a big volume but buying volume is being appeared with the continuity and consistently, therefore the buying volume can cancel these bearish signals.
Now if we take a look at the balance of power indicator then it can be clearly observed that the balance of power is equally distributed between the bears and bulls. On the chart there are 6 obvious downward moves and 6 openly upward moves by this indicator. And the price action is also following the moves of the balance of power. At this time this indicator has made its 6th upward move and the price action has reached at the resistance. Therefore we can expect the seventh downward move by this indicators.
Consistent formation of BATs:
Now let me show you the formation of different harmonic BATs with the continuity. On the daily chart the price action of BCH has completed the formation of third BAT pattern and it is forming these harmonic patterns consistently. Let’s dig these patterns out to watch the how perfectly they are formed:
After initial leg the A to B leg is retraced between 0.382 to 0.50 Fibonacci. And B to C leg is projected between 0.382 to 0.886 Fib projection of A to B leg. And the final leg has been retraced between 0.786 to 0.886 Fibonacci retracement level. And all these BATs has followed the same Fib sequence. Therefore after the completion of third bearish BAT pattern we can expect a downward move from here.
Simple moving averages and resistance of 200 SMA:
Now if we watch the simple moving averages with the time period of 25, 50, 100 and 200 then the price action has crossed up all the moving averages. But only 200 SMA is left to crossed up and if we take a closer look on the chart then it can be easily observed that since April 2020 the price action has made several attempts to break out this simple moving average but so far it is unsuccessful. And at this time the priceline of BCH is struggling at this 200 SMA resistance level again. However this time the priceline of Bitcoin cash has the support of 100 simple moving average, therefore if price action will be dropped from here then it may re-test the 100 simple moving average as a support before any other move to the upside.
Support and resistance levels:
I the month of Feb 2020 the price action was very strong bullish and reached very close to the key level resistance of $500 but unfortunately after reaching at $497 a strong bearish trend was started that leaded the priceline to the first support at $147. After getting bounced from this support level the priceline of BCH broke out the next resistance of $220 and re-tested the previous resistances as support and moved up to breakout the next resistance at $260. So far it is moving between these support and resistance levels between $220 and $260 and now it has formed a parallel channel between these levels. Once the price action will breakout this resistance then it can go to the next resistance at $304 and after breaking out $304 the next resistance would be at $355 and in case of breaking out this hurdle the key level resistance would be at$ 500. If the priceline will breakout $500 then it can reach the highest right ever in the history of Bitcoin cash very soon.
Ichimoku cloud and directional movement:
On the long-term weekly chart the Bitcoin cash is never able to cross up the ichimoku cloud since this cloud is appeared in the history of BCH as per coinbase exchange. We have witnessed several attempts since may 2019 to break out this cloud but unfortunately so far the price action is moving below the cloud. This time the cloud is turned very weak and the lagging span of the ichimoku is crossing up the candlesticks. This is the first bullish signal that we have received now we can wait for the conversion line to cross up the baseline. And once it will be happened then the ichimoku cloud will be turn bullish and it will be easy for the priceline to breakout this cloud and breaking out this cloud will become a very strong support for the price line of Bitcoin cash to start a very long term bullish rally.
If we take a look at directional movement indicator then positive directional indicator has crossed up the negative direction indicator. That is the bullish signal indicating that on the long-term the Bitcoin cash can started a bullish rally. Before this in April 2019 when the positive directional indicator crossed up the negative directional indicators then Bitcoin cash produced 330 % bullish rally. And after that in January 2020 when again +DI crossed up the –DI then the price action of Bitcoin cash started a bullish rally up to 138%. Now the wait is only for the ADX to move up to assign the power to the bulls.
Big bullish Gartley a firm signal for long term bullish move soon:
Now I would like to recall a very big bullish Gartley pattern that is formed on the monthly chart by the price action of Bitcoin cash. I also a posted this pattern in my previous post as well. After entering in the potential reversal zone now the price action is moving just above this PRZ level and it can start movement to the upside very soon. This bullish Gartley can be very helpful for the priceline to start a long term bullish move.
Conclusion:
On the daily chart the bearish signals are more than the bullish signals. Therefore we can expect a correction rally up to the support of the wedge that has been formed on the daily chart. But on the long-term chart the Bitcoin cash is turning very strong bullish specially after the completion of very big bullish Gartley pattern on the monthly chart. So the countdown for a very big upward move has begun.
Note: This idea is education purpose only and not intended to be investment advice, please seek a duly licensed professional and do you own research before any investment.

BCH/USD - trade from levels.
I take extreme movement like a double bottom.
Target is $238-$240.
Buying at Fibonnacci level 0.61 and 0.5
This is the area where yesterday's opening price is.
$233 is a mirror level.
You can't break through it the first time.
We'll have to go for good power.
Push ❤️ if you think this is a useful idea!
Before to trade my ideas make your own analysis.
Thanks for your support!

BCH/USD - trade from levels. Last idea came up 100%.
An important level noted the orange line to which you can tie the stop loss.
Long by Fibonnacci levels.
An important level acts as a stop loss anchorage.
Push ❤️ if you think this is a useful idea!
Before to trade my ideas make your own analysis.
Thanks for your support!

BCHUSDt AnalysisHello friends.
Please support my work by clicking the LIKE button(If you liked).Thank you!
Everything on the chart.
We are in ascendind triangle.
you can enter the market if the current stop loss is satisfactory for you.
or a safer option is to open a position on breaking through 255 with stop loss under a level
Targets: ~275 and ~290$ (after first target will reached move ur stop to breakeven)
cancellation of growth if we rollback and consolidation below 230
Follow me on TRADING View, if you don't want to miss my next analysis or signals.
Good luck.
It's not financial advice.
Dont Forget, always make your own research before to trade my ideas! If i help you to earn some money i will RLY VERYVERY appreciate for your donate.
Also open to your questions or suggestions(PM to me).Will be glad earn some money for me and you.

BCH/USDT - Head & Shoulder#nosignal
Looks pretty valid, neck breakage really hasn't happened yet, so complications are possible.
Push ❤️ if you think this is a useful idea!
Before to trade my ideas make your own analysis.
Thanks for your support!

BCH heading to the top of Rectangle Pattern (Buy Now to hit 247)Thank you for supporting me with your likes and views, kindly leave your reviews and opinions behind

BCH/USD LONG SET UP FOR (BULL RUN BREAKOUT)Key Highlights
• BCH/USD continues to see a series of lower highs in its market valuation.
• There is a likelihood that a notable move will soon experience past an upper range line at $280.
• A break of either of the two range points at $280 or $240 will signal a definite price direction in BCH/USD market operations.
Bitcoin Cash (BCH) Price Analysis
• Major distribution territories: $320, $360, $400
• Major accumulation territories: $200, $160, $120
There has continued to be a series of lower highs in the market valuation of BCH/USD. The base-crypto has relatively risen northbound, to hit a strong distribution territory at $280 as it had earlier done on April 8. Price now hovers around $280 and $240 price values. Price now hovers around $280 and $240 price values.
The bulls’ pressures are now seemingly gathering momentum on a weak mote. And, for the second time that the $280 mark touched, there is a likelihood that a notable move will soon experience past the price line earlier mentioned.
IF YOU MISSED SIGNAL AND WANT TO GET IN! USE THIS SET UP
BUY LIMIT BCH/USD
ENTRY 1 $245.50
ENTRY 2 $238.50
SL $230
TAKE PROFIT 1 $270.50
TP.2 $306
TP.3 $336
TP.4 $360
Tp.5 $420
Tp.6 $500

BCHUSDT LONGSignal
BCHUSDT
LONG
Open 247.83,
SL 235.41,
TP 303.91,
Risk/Reward: 1/4.52,
Leverage: 2x

BCH/USDBCH/CASH reacted to its support line and will move upwards.
FOLLOW ME. STAY INFORMED UNTILL THE ANALYSIS IS DONE.

a short up wavei think for little BCH will continue to rise, may go around $270-$290 but it won't stay there for long and start falling back to around $200 - $220.
it bit risky to enter into any trade given current market conditions.
i think i will wait for trade to come to me at around $175 - $190 zone rather chasing it at $225 and above.
these are my own notes, not a trading advise. please do your own research before entering into any trade.

Cash?Bitcoin cash has formed a descending broadening wedge
This formation will likely lead to a break to the upside with the positive momentum that is occurring within the wedge
Top cap indicator can be use to observe the potential of such a coin
Gann analysis also included for XBT pair
Bitcoin cash has a very strong presence within social crypto climate


#BITCOIN CASH Weekly Analysis#BITCOIN Cash ( Long Term )
Prices are still positive, we expect Bitcoin Cash to rise from these areas
The most important thing is not to close a weekly candle below the trend line
Take Care !
Do not hurry to buy, the price may go down to good places


BCH USDHere we are with a perfect reversal, if this breaks above 345, the upper resistance of the ascending triangle, then real fireworks will come.
It already corrected with an ABC wave, and there is a bullish divergence both on MACD and RSI.
Halving is in 34 days by now.
That said, we are in a bigger ascending triangle, which could propel the price to above 1000.
Check my previous post about BCH if you wanna know what I mean.
This post is for educational purpose, not a financial advice, if you have any questions feel free to ask.
Good luck with your trades :)

BCH | After Being Rejected By $501 Getting Ready For Next MoveBounced Back From Key Level Resistance $501:
Hi friends welcome to the new update on Bitcoincash. Guys if you remember I posted an article on 2nd Feb 2020 where I told you that the BCH is going to hit its key level resistance at $501 at that time the price of Bitcoin cash was $378 and then it moved up to $497.53 that was very close to resistance level as I predicted in my previous post. And as I have been telling you that this is the key level resistance for the Bitcoin cash as the Bitcoin cash is not able to break out this resistance level since November 2018 once this resistance level will be broken out then Bitcoin cash can start more stronger rally towards achievement of the highest price in the history of Bitcoin cash for which many traders are waiting.
But unfortunately this time again the priceline of Bitcoincash is pushed down by the resistance of $501 in very powerful manner that this time price action even broke down the previous support of $355 and after breaking down this support the Bitcoincash moved back to the next support at $304 again.
At this support level the price action started consolidation and now it is likely to move up again towards the resistance level of $355. Here we also have 100 simple moving average support just beneath the 304 dollar support.
Simple Moving Averages Are In Good Order:
If we see the simple moving averages with the time period of 25, 50, 100, and 200 then sofar they are in good order the 25 simple moving average is above all other moving averages then just below 25 moving average we have 50 moving average after that we have 100 moving average and 200 SMA is just below all these moving averages. Sofar no moving average has formed any death cross with other moving averages. At this time we can see the 25 moving average is showing the tendency to move down to form a death cross with 50 moving average. But this death cross cannot produce the pressure that can lead to breakdown the support.
If we place the Fibonacci retracement to from the recent lowest price of $170 up to recent high of $497.53 then we can examine that the price action is retraced up to the golden ratio of Fibonacci level that is 0.618 Fibonacci then it is likely to up from here.The 100 simple moving average is also playing is very important role here as it is just below this golden ratio of 0.618 Fibonacci level to provide a strong support to priceline of Bitcoin cash.
Oscillators And Indicators Are Turning Bullish:
If we see some other oscillators and indicators then we can observe that on daily chart all oscillators and indicators are also turning bullish. For example the price action is getting bounced from the lower bands of bollinger bands and Reletive strength inex (RSI) has already visited the oversold zone and turned bullish now. If we see the stochastic then it can be clearly seen that the stochastic has given bull cross from the oversold zone and moving average convergence divergence indicator (MACD) was strong bearish but now it has also given weak bearish signal and that is also another bullish sign.
We Need The Priceline To Cross Up The Exponential Moving Averages To Back In Rally:
On 2 day chart above exponential moving averages with the time period of 10 and 20 we can see that price action was moving above these EMAs from January 7th up to 18th Feb 2020. But now the priceline has crossed down these eponential moving averages and both EMAs have formed bear cross now it is really very important for the Bitcoin cash to cross up these moving averages again in order back in bullish rally.
A Bullish Harmonic Pattern Is Always Helpful To Move The Priceline Back To Bullish Trend:
Here a very strong bullish continuation signal is appeared and that is the formation of bullish Cypher pattern let's dig this pattern deeper and see how perfect this pattern is formed. Initial leg was started from 25 December 2019 up to 17th of January 2020 then B leg is retraced between 0.382 to 0.618 Fibonacci. Then priceline started B to C leg and projected up to 1.414 Fibonacci projection of A to B leg. Then C leg is retraced between 0.618 0.786 Fibonacci. And this is the Fibonacci projection of X to C leg here formation of bullish cypher pattern is completed and the priceline is moving up. Guys this pattern can be great help for price action of Bitcoin cash to break out $355 resistance.
Ichimoku Cloud Turned More Bullish:
In my previous article we have seen that the ichimoku cloud was turned bullish up to 4 days chart. But now it has turned bullish up to 1 week chart. After crossing up the cloud now the candlesticks are retesting the bearish cloud as support. The lagging span is above the price action and did not cross down the priceline but once it will cross down the priceline then we can see e a bearish trend.
Here I have placed the chop zone indicator and we can see that the chop zone is turned weak bullish before that is was strong bullish from 13th of January upto 24th of February but this week it has turned weak bullish. We need to observe this indicators for next couple of days if it will be turned bullish again then candle sticks with lagging span and conversion and base lines cross up the cloud and then we can see the ichimoku even more bullish.
But if this chop zone will be turned bearish from here then the BCH can face bearish trend.

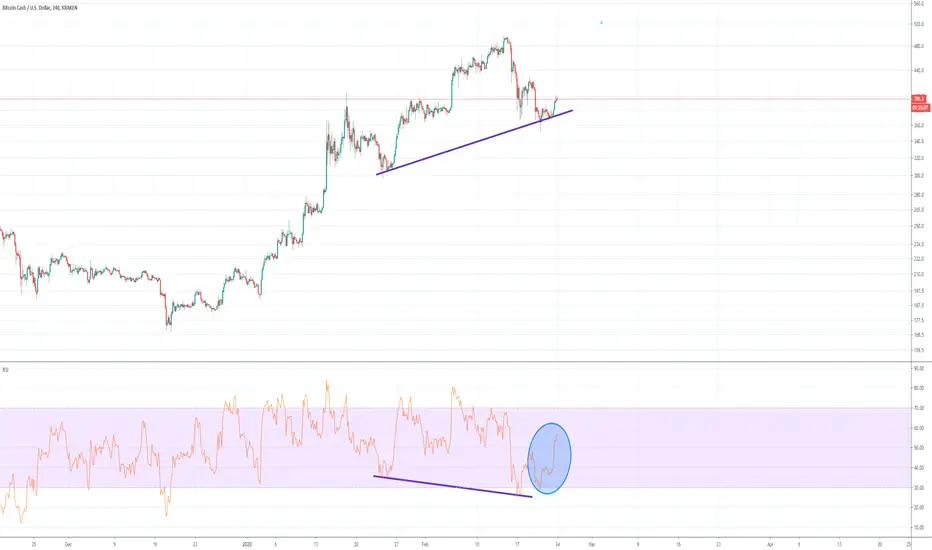
BCH Classic Bullish DivergenceA classic bullish divergence has formed on the BCHUSD pair, a rise in RSI can already be seen to be occurring, bullish divergences are reliable ways to identify trend continuations. This will produce further upsides for the pair. A lot of divergences lately!
#Bitcoin Cash Strong support#Bitcoin Cash Usd ( Short Term )
Targets expected to be reached :
Target 1 : 432 $
Target 2 : 459 $
Target 3 : 491 $
Please share your opinion in the comments box and do not forget to press the like button
Check out some of our previous analyzes and don't forget to click on the "Like" button

BCH/BTC IdeaWe have retested support after initial breakout. If we can hold this level as support (4200), then I expect continuation towards the upside.

BCHUSD - Buy 04/02/2020Friends, please before reading, support this idea with your Like and any Comment, thanks.
You can buy BCHUSD from 360-350
Stop-loss at 340
You will find more trading ideas in SAV Finance community.
