BE =5.10 (BUY and HOLD) Pump and Dump - Bloom EnergyHi friends, this action just from my sheet, on the strategy of Pump and Dump.
Buy on 5.12$
Stop = $4.50
Profit = $10.66
Stop 11%
For profit 100%
The risk of a yield of around R=10
I really like such actions. especially when you realize that their potential is huge.
My experience, against technical indicators, and fundamental.....
THE ANALYSIS:
the screener shows that the timeframes are 1 hour, 1 week, and 1 month. Definitely sell the commodity.
Putting 1 month. technical expertise. Let's see. Personally, I Bought, although indicatory say the opposite....
What pokazet on Skinerror...
Summary: strong SELL
Chip. average: SELL Buy (3) Sell (9)
Technical indicators: ACTIVELY SELL Buy (1) Sell (6)
Turning points 17.08.2009 19:12 GMT
Name S3 S2 S1 Pivot point R1 R2 R3
Classic of 5.84 7,90 of 9.18 11,24 14,58 of 12.52 of 15.86
Fibonacci of 9.18 7,90 13,30 of 12.52 of 9.96 11,24 14,58
Clique of 9.84 at 9.53 10,14 11,06 11,24 of 10.76 at 11.37
Woody 5,44 7,70 of 8.78 the 11.04 12,12 of 14.38 and 15.46
Demark - - 8,53 10,92 11,87 - -
Technical indicators 17.08.2019 19:12 GMT
Name Value Action
RSI(14) 100,000 Overbought
STOCH(9,6) 22,293 Sell
STOCHRSI(14) 0.000 Oversold
MACD(12,26) 1,120 Buy
ADX(14) 20,310 Sell
Williams %R -97,916 Oversold
CCI(14) -98,2874 to Sell
ATR(14) 8,3886 High volatility
Highs/Lows(14) -8,2050 To Sell
Ultimate Oscillator 45,098 Sell
ROC 0.000 Neutral
Bull/Bear Power(13) -6,1400 Sell
Buy: 1
Selling: 6
Neutral: 1
Summary:strong SELL
Chip. average 17.08.2019 19:12 GMT
Period Simple Exponential
MA5 of 10.45 to Sell 9,30 to Sell
MA10 of 11.55 to Sell 12,78 Sell
MA20 11.32 Sell 16.03 Sell
MA50 is 4.53 Of 19.66 Buy Sell
MA100 2.26 Buy 21.24 Sell
MA200 1,13 Buy Of 22.12 to Sell
Buy: 3
Selling: 9
Summary:SELL
FUNDAMENTAL ANALYSIS:
1.) The income statement will BE
Gross profit TTM 11,53%
TTM operating margin -30.02%
TTM -42.08 profitability ratio%
Return on investment TTM -40.7%
Period up to: 31.03.2019 31.12.2018 30.06.2018 30.09.2018
Total income 200,71 213,61 190,19 168,88
Gross profit 15,76 17,25 23,39 32,77
Operating income -72.64 -88.18 -66.11 -5.25
Net profit -84,44 -99,78 -78,58 -45,68
2.) Balance sheet BE
The quick ratio MRQ of 1.89
The current ratio MRQ of 2.32
Total assets total liabilities
Period up to: 31.03.2019 31.12.2018 30.06.2018 30.09.2018
Total assets 1318,85 1389,67 1445,14 1157,74
Total liabilities 1424,29 1481,33 1530,12 1918,91
Total equity -105,44 -91,66 -84,97 -761,18
3.) Statement of cash flows BE
Cash flow per share TTM -2.57
Earnings per share TTM 7.05
Operating cash -1.51%
Period up to: 31.03.2019 31.12.2018 30.06.2018 30.09.2018
Period: 3 Months 12 Months 9 Months 6 Months
Cash from operating activities -4.17 -58.42 -13.65 -18.59
Cash used in investing activities is 95.11 -94,83 of 15.42 of 9.67
Cash used in financing activities -1.49 253.12 261.84 -21.83
Net cash change 89.45 99.87 263.61 -30.74
* In millions of USD (except for shares)
Be


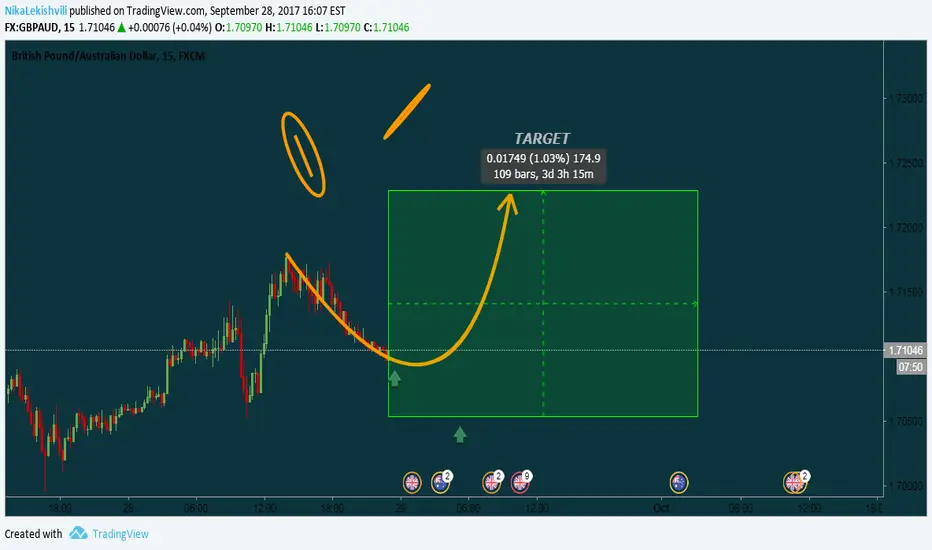
Elevator Ready To Go UpstairsThe pair has dropped for the whole may, and the price is currently sitting on trendline support where also daily 200 ma is located.
It's also currently bottom for the channel and bulls could take the dominance from these levels.
There are few "roadblocks" for the upside movement naturally, and the first one is on the 1.83 ish where the decision for the trend is to be made. If the bulls are successful with capturing the 1.83 and pushing through the resistance probability for the wick fill located at the 1.85 is likely to happen.
Happy and safe trading!

At Least 100 Pips Correction ComingYen has been steady, and when it's strong, the ride feels like never-ending. However, the price has arrived in weekly 61.8 fib, which suggests that some correction will happen.
The overall trend, of course, is bearish that's clear as blue sky, but I'd see price correcting at least 100 pips to top of the channel before it's clear which one is dominating from that point.
I will play this one safe with 30 pips stop loss and targeting to 137.900 ish, giving the slightly over 3:1 RRR.


BE bullish news. Bonus on CKKTrades are set. just not feeling good today so i will pause trading and rest to prevent mistakes and losing money. trade safe


BTC/USD - WE ARE GOING TO THE MO---- wait a second...Played around with the fib channels on the largest time frame I could find on TV and guess what, it does not look good from here. This chart is telling me to short until
1.5k. The tether news is causing a lot of speculation. This is exactly the time not to try to make assumptions of what might be going on, in terms of the news, and instead check your chart to make sure you understand the overall trend. By this I mean get the biggest time frame you can find and chart it. I hope this chart doesn't play out, but its better to be defensive when trading in my opinion. I heard a great quote today: "once you stop losing money you'll start making money". Good luck everyone.
Target 1: $1500
The red line indicates my target.
This is a log chart.
This is not financial advice. All charts shown on my page, including this one, are just for fun.
If you enjoy my ideas please give this post a like and follow my page if you would like to see future posts! :)

Ascending bullish triangle. My motto is "keep it simple"!
What do you see when you look at the chart? You can see that the price get rejected from the purple horizontal line (resistance) and its trading within a ascending triangle. This is a bullish sign, as it shows that the bulls are still in the market, however, there could be easily done some manipulation and long squeeze.
Its very important to watch the price, once it closed on 4H candle under the triangle and breaks the 100 EMA, you should be closing any long possitions, so watch your stop losses!
If the price dips under the 200 EMA, there will be oportunity to go short up to the orange line, where is a strong support. If this support will be broken, bitcoin will dip to retest its lowest lows.
We should see a major move within the end the month or soon by the start of may, I am more bull than bear, clearly by looking at alt market and the lacking overbought indicators.
I believe we should retest the 5800 - 6200$ mark, if the triangle will hold up, before making a correction at those levels.


Be Aware Of THIS ScenarioBe Aware Of THIS Scenario
Should we actually break down, which is very possible, then do not panic!
I see that in people who act emotionally, again and again.
You are selling, Bitcoin is actually going down $400-300 and you are thinking that it will fall more.
After a few hours you will see that the price is back above your selling price and that's how the clever people manage to reduce your money.
Mostly, you hope that the price will go down a bit more to buy at least at your retail price.
What is happening? The price goes up and up until you are forced to enter emotionally, just when you are in a correction again.
At my last Bitcoin idea you have seen that I am very uncertain about the current situation.
The question I asked myself was:
Scenario 1: Are we going up now?
Scenario 2: Are we going to make a bigger correction before going up?
Personally, I prefer the second scenario because it would 'kill' the longs again before it goes up.
But I think that the first scenario will happen, because it looks very much like a structure I know.
So, no matter what happens now, I assume that we will go up afterwards and people will be scared.
The market decides.
Note: I'm sorry that I upload this idea for the third time now. Had problems to show both scenarios in one idea to make it clearer.


GU long..Probably an ambitious target but hey, we have it simple, break and a retest of previous resistance trend line, rejection of the 50% and -27% looking at a 500+ pip long here. Almost forgot to mention the bullish engulfing candle on the daily closing above previous support. Has created is Higher Low, Perhaps on to new Higher Highs.


ETHUSD: Breaking the parallel: longs should be outETH USD
As per earlier warnings about this impulse wave being in its 4th and likely final pulse upwards,
profits should have been taken by now. Now it's a near term short on a retest of the parallel from below

Bitcoin: BTCUSD Update - Breakout could be soon nowBitcoin Update
Bitcoin is still trying to grind higher, now testing critical near term resistance at 7717 where the fixed and dynamic
resistance lines meet on the chart. Even if it's low volume, this breakout, should it occur at any point, should be
followed for a move back to 7990-8000 where look to close out and short (only if day trader) with stop 50 points
above 8000. Bitcoin is unwinding an overbought condition reached on Friday by trading sideways right at the top, in
the space you'd expect a very strong stock to consolidate in. It's not been sold off really, not recoiling as it would do
if showing underlying weakness at these levels. ..at some point it's going to beat 8000 by 20 points, could even be
this weekend, and when it does it should be followed with stops about 100 points under 8000.
But in near term it will likely fall away from here...don't sell it though unless you use a tight stop above the upper
parallel. Wait, watch for the break to the upside. Be Lucky

Bitcoin: BTCUSD This could be the low,take some profits at leastBitcoin BTCUSD
need to be carefulnow to watch htis isn't turning here by making a right shoulder off support at 6300...
Earlier, it was noted that 6300 marks 20% from the top, standard text-book stuff. It's Ok to fall 21% intraday, but not
fall more than this (19% to 21% is standard stuff, right?) - well, spookily, 21% off the top is 6240 - and the low so far is 6218.
So it could be here...lower stops to just above 6530, they may get hit so swing traders make about 400 points, maybe more if
it swings lower from here, but am thinking more that this really could be the low for now...doesn't look quite over yet,
and want that hit on the lower parallel at 5997 in ideal world before closing out and going long with a stop under 5990 -
ready to short again if this level gives way (small loss but for spreads if wrong on the long...)
That's the ideal, a complete flush out right back to the base of the stucture...but we might nor see it. Bitcoin likes to do
things by the text book so far, so maybe 21% extreme could be the limit...so at this point you can close out at 6340 ish
and take 600 points plus profit and take a break, or can set stops as suggestedif a swing trader, or you can stay with it,
but risk reward is diminishing now. Maybe close out half and run the rest, ready to close out at 6000 if tested and play it
from there as above. And if 6000-5990 gives way it's another short...Stay Lucky.
On upside, when eventually the upper parallel is broken on upside and if it then survives the first retest,from above, start
building long positions for rally to 6943 and short again from there with stop above.


DXY: Dollar Index neutral now, next break imminent, follow it.DXY: The dollar index has slipped into near term neutral as markets decide the next break. When it makes up its mind the move should be followed on USDEUR
