Nasdaq QQQ Bear Flag - How to TradeI'm writing this as a tutorial and a play by play of my trading, also as an analysis of how I traded this incorrectly.
This morning, before the market opened, I saw a perfect bear flag on QQQ (I was using Nasdaq Futures to trade it).
I just wanted to talk about the range of emotions when trading a pattern that clearly shows strong bullish price action, but since the channel is coming after yesterday's huge sell off, we know sellers are waiting patiently for the continuation of the recent trend.
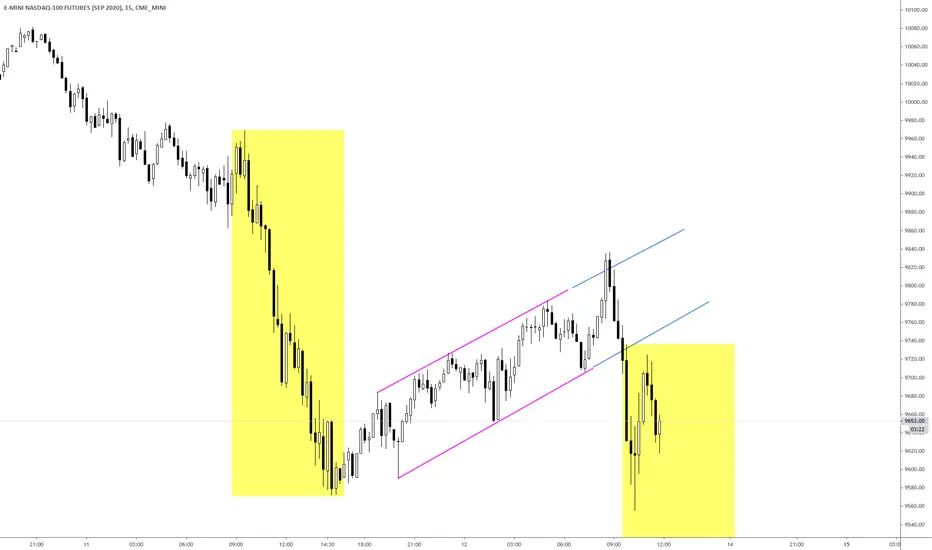
In the morning, I could only draw the bear flag based off the purple lines. The blue lines represent what happened after the market opened. As a side note, I love trading Nasdaq Futures because the patterns are near perfect and well respected. I wont trade SPY because SPY merely reacts to what Nasdaq is doing, and as a result, has more fakeouts and imperfect patterns.
I was anticipating the touch of the top of the bear flag channel, but it's hard to ever be prepared for an overshoot / fake out. When the fake out was happening, I was thinking I misread the chart and bulls will continue to buy and the bottom was is in. It's important to never lose sight of the overall picture, and it's very easy to lose sight of the overall picture when the price is moving bullishly against you. I'm partially writing this for myself as a reminder, and I hope this helps others.
When the price fell back into the channel after the fake out, I imagined bulls went from feeling euphoric to fearful, but still hopeful and embolden from the recent price action. When price tested the top of the channel and confirmed it was resistance, the bulls lost that hope, it was time to bail and it was time for sellers to make their move.
As a bear, (my bias is from the recent sell off, plus see my related idea where I predicted the top of Nasdaq to the exact cent) when I saw the price test the top of the channel as resistance and then drop, I was worried that the price would find support near the previous high, causing me to take profit. I'm an experienced traders and I'm still controlled by my emotions. The price bounced around in this area due to others like me taking profit on their short. The last remaining hopeful bulls that thought the price would find support on the local high, and the fearful bears like me who thought that support would hold. When it was clear that this support wouldn't hold, I lost my solid entry which was at the top of the channel, so I missed the meat of the trade. Bulls started panicking as the sell off took place, and bears joined the down trend in hopes for the price to reach the bottom of the channel. Since this was the third touch to the top of the channel, bears had every right to assume that the price would not only reach the bottom of the channel but it would also break below it. Other bears are not only anticipating that break, but they are betting that the bear flag will play out in full, with the projected target (yellow) being the length of the bear flag's pole when applied to the bottom of the channel. The yellow target may not play out since the overall trend is still bullish, it would be better to believe in a target like this when the trend is bearish on all time frames.
When it doubt, zoom out and stay focused on the overall picture. Even experienced traders like me who have years of experience still take profit early sometimes and are overcome by their emotions. Cheers to anyone who traded this pattern without their emotions holding them back.
Please see my related idea below on where I predicted the exact top of Nasdaq. I'm proud of this prediction, and I was able to predict the top of SPY and AAPL using a similar method. Institutions simply trade between the lines, and despite all of the news about new traders in the market from Robinhood, institutions still run the show and they let everyone know it.
Bearflagpattern
BTC/USD 1Hr. Gravestone Doji on 4Hr & Bear flag 1Hr.Looks short to me, I note price dropped out of the ascending trend line & appears to be trying to climb back in, but, on the 1Hr we have a nice bear flag forming and on the 4Hr we have a gravestone doji. My short target is indicated with the white arrow.@$7800.

$ES_F bearflag breakdown into h&s on the 15 min$SPX $SPY $ES_F As you can see, there's a bearflag breakdown currently bouncing from the would-be neckline of a h&s that I think will form a right shoulder and retest the broken bear flag channel.

S&P Futures in an hourly bearflagS&P Futures had a weak bounce and has formed a bearflag on the hourly chart.
Currently trying to break said flag. If volume picks up, this could get ugly!

Is this a bear flag? We'll find out todayStng has some incredible volatility over the last days as well as record high volumes. Kinda an unpredictable stock for the short-term. Oil is rising again and tanker rates are falling. Imo Q1&Q2 are already priced in. Today's results will help us understand where this one is going...

Is the next Major Crash Beginning?Is the next big crash starting?
OANDA:SPX500USD
I've been watching the S&P closely for the last month during our recovery phase. It's been a great ride up, but today it's starting to look like the cracks are once again forming.
The below analysis is as I see it. This is not advice. Please do your own research before entering any trade.
Signs of a potential reversal:
1. We have recovered to the point of reaching the "Golden Pocket", which is the idea place to open a short for minimizing risk, between the 50 and the 61.8 Fibs.
2. We have seen a bull flag formation on both the Daily and the 4hr, with both breaking down and out during the last trading session.
3. We rejected off the 50 day moving average on the Daily.
4. Moving average on Volume is reducing.
5. MACD line has turned and looks poised to cross down below the signal line.
6. CCI is trending down and fallen out of upward channel.
None of this guarantees that a crash is coming, but it's certainly got me interested.
Potential SHORT Trade Setup
ENTRY: 2740-2770 (Anywhere here)
STOP LOSS: 2970 - 6.89% (Clear those fibs)
TAKE PROFIT 1: 2320 - 16.73%
TAKE PROFIT 2: 2176 - 21.70%
TAKE PROFIT 3: Let run
RISK:REWARD: 1:2.4
As per normal risk management practice, once the trade starts moving, reduce your SL and potentially apply a Trailing Stop in a fast moving market.
Please DO YOUR OWN RESEARCH!!
Happy Hunting!


DXY analysis by CryptonikLion Very interesting, so DXY broke up from the failing wedge that was ending in 98.8 area and had a massive breakout so the next short term target i expect on DXY is 100.6. I expect that here a wedge-bear flag might be in play, so i am bearish on DXY, not just form TA but also from fundamental perspectives.
We got a 61.8% retracement move i drew the fib from the gap candle so we can see why we got a bounce and i discovered that from 61.8% fib retracement, and we got a good bounce from that fib level.
I want to say that we have a higher low and we shall see if we make a lower high (C),if we get rejected from 100.6 we might go back to 0.5% fib level (D) and after that one more wave (E), and then the interesting things will start to happen.
If the price will respect the (A-E) targets i expect 96.94 (bearish scenario) or 102.3 ( bullish scenario).
My personal opinion is that we will go down,but we might fill the gap at 102.3 first.
But i am bearish on DXY in the mid to long-term.

How to Trade Bull & Bear Flag Pattern | Flag Pattern Tutorial !Bull & Bear Flag chart patterns Tutorial!
Bull Flag : A bull flag forms in bullish trending market, After a strong bullish movement when this pattern forms it signals the market is likely to move more higher. Bull flag pattern much similarly looks like a horizontal parallel channel or downward parallel channel along with a strong bullish vertical rally; when we draw the pattern it looks like flag on a pole, that's why they are called bull flags.
How to identify and Trade Bull Flags : - It is easy to identify a bull flag you just need to look for a Bullish Vertical Rally or Trend which is Pole of the Flag then identify the consolidation which will look like either horizontal channel or downward channel which will be the Flag. After identifying the pattern you can enter at the bottom of the flag or you can enter when price breaks the upper trendline of the flag which is more safe.
The breakout may also be a fakeout that's why we will take help of Volume and RSI Indicator to confirm the breakout. As shown on the below example you can see when price breaked the uppper trend of the flag the Trend drawn on the RSI was also broke and the Volume was high.
()
( *Key things to know : If the retracement measured from the vertical rally or Flag Pole retrace more than 50% the pattern becomes weak and it may not be a Flag Pattern but sometimes it stays valid if it breakouts above the uppertrend of the flag.)
Bear Flag : Bear Flag is just the opposite of the Bull Flag Pattern. A bear Flag forms in bearish trending market. Bear Flag pattern signals the market is likely to drop more lower. You need to identify Bear Flag in bearish trend when the price of a financial asset drops then if the price forms a horizontal channel or upward channel which will look like a inverted flag whose flag pole will be upside and the flag will be downside.
Stay Tuned; 👍
Like this tutorial & share your comment below and also
check other tutorials with example linked below;
Thank You-
