USD/CHF BEARS ARE GAINING STRENGTH|SHORT
Hello, Friends!
We are now examining the USD/CHF pair and we can see that the pair is going up locally while also being in a uptrend on the 1W TF. But there is also a powerful signal from the BB upper band being nearby, indicating that the pair is overbought so we can go short from the resistance line above and a target at 0.817 level.
Disclosure: I am part of Trade Nation's Influencer program and receive a monthly fee for using their TradingView charts in my analysis.
✅LIKE AND COMMENT MY IDEAS✅
Bearish Patterns

USD/CAD SENDS CLEAR BEARISH SIGNALS|SHORT
Hello, Friends!
We are going short on the USD/CAD with the target of 1.375 level, because the pair is overbought and will soon hit the resistance line above. We deduced the overbought condition from the price being near to the upper BB band. However, we should use low risk here because the 1W TF is green and gives us a counter-signal.
Disclosure: I am part of Trade Nation's Influencer program and receive a monthly fee for using their TradingView charts in my analysis.
✅LIKE AND COMMENT MY IDEAS✅

TSLA PRICE ACTION 1ST JUNE 2025This is the updated price action of Tesla. I have explained why I exited long positions. If you have any doubts, then feel free to leave a comment below.
NOTE: STAY AWAY FROM TSLA LONGS

Double Reject @ March Resistance Spells Good News For GJ BearsOANDA:GBPJPY struggles to reach Higher Prices then that of the High created on March 27th and leads me to believe we could see a Double Top Pattern in the making!
Confirmation of the Pattern will come when:
1) Price declines back to 191.877
&
2) Makes a Breakout of the Confirmation
Once the Pattern is Confirmed and Breakout is Validated:
- This should deliver great Short opportunities as a Double Top Breakout & Retest Set-up!

As ECB Ready's "Final Cut", EJ "Begins Reversal"OANDA:EURJPY has began to potentially form a very strong Triple Reversal Pattern, The Head and Shoulders @ the Resistance Level lasted visited May 14th.
I say "potentially" because the "Right Shoulder" or recent Lower High has been created but we still wait for the final decline to the "Neckline" or Support Area formed by the Lows separating the "Head" from the "Shoulders" or Higher High from the Lower Highs in the pattern!
Signs of Potential Head & Shoulders:
1) Left Shoulder is an Oversold High
2) A Higher High is created at a level of Resistance
3) The Head not only has the Most Volume concentrated in the Pattern, but is also the start of the RSI Divergence from Price
4) Right Shoulder is formed and unable to surpass the Left Shoulder
..Bringing us to a very important tell..
5) Volume Decreases and logs a 3rd Divergent High in the RSI @ the creation of the Right Shoulder
Now we must WAIT for CONFIRMATION of the Pattern!
This will come when Price:
1) Declines to the Neckline
&
2) Makes Successful Breakout
Once the Head & Shoulders is Confirmed and Breakout is Validated:
- This could deliver great Short opportunities as a Head and Shoulders Breakout and Retest at the Neckline being the Last Line of Defense for the Bulls if Bears can push Price through and pick up Volume!
Fundamentally, BOJ Governor Kazuo Ueda will be speaking on Tuesday, June 3rd where we could see volatility come in for JPY.
The ECB is expected to cut rates by 25 bps from 2.4% to 2.15% on Thursday, June 5th and this could be the Last Cut we see the ECB plan to make until they see downside growth risks make more cuts likely.

NG1! BEARS ARE STRONG HERE|SHORT
NG1! SIGNAL
Trade Direction: short
Entry Level: 3.461
Target Level: 3.044
Stop Loss: 3.737
RISK PROFILE
Risk level: medium
Suggested risk: 1%
Timeframe: 12h
Disclosure: I am part of Trade Nation's Influencer program and receive a monthly fee for using their TradingView charts in my analysis.
✅LIKE AND COMMENT MY IDEAS✅

GBP/NZD SHORT FROM RESISTANCE
Hello, Friends!
The BB upper band is nearby so GBP-NZD is in the overbought territory. Thus, despite the uptrend on the 1W timeframe I think that we will see a bearish reaction from the resistance line above and a move down towards the target at around 2.218.
Disclosure: I am part of Trade Nation's Influencer program and receive a monthly fee for using their TradingView charts in my analysis.
✅LIKE AND COMMENT MY IDEAS✅

GBP/AUD SENDS CLEAR BEARISH SIGNALS|SHORT
Hello, Friends!
Previous week’s green candle means that for us the GBP/AUD pair is in the uptrend. And the current movement leg was also up but the resistance line will be hit soon and upper BB band proximity will signal an overbought condition so we will go for a counter-trend short trade with the target being at 2.041.
Disclosure: I am part of Trade Nation's Influencer program and receive a monthly fee for using their TradingView charts in my analysis.
✅LIKE AND COMMENT MY IDEAS✅

Extreme complacency is a major warning sign ! I have used the put call ratio to identify some very extreme readings in market sentiment.

USDCAD Makes Retest At 200 EMA After Bull Trap BreakoutOANDA:USDCAD here on the 1Hr Chart has printed an Ascending Channel and Bears have made a Breakout!
Price currently looks to be on its way to retesting the Breakout of the Channel with the 200 EMA and Upper Bollinger Bands sitting at the Rising Support adding some heavy Bearish Pressure.
Fundamentally, BOC will be releasing GDP m/m ( Gross Domestic Product ) numbers tomorrow morning at 0730 AM CST with analysts forecasting a .3% Increase at .1% with Previous being -0.2%.

USOIL SELLERS WILL DOMINATE THE MARKET|SHORT
USOIL SIGNAL
Trade Direction: short
Entry Level: 61.25
Target Level: 56.17
Stop Loss: 64.55
RISK PROFILE
Risk level: medium
Suggested risk: 1%
Timeframe: 1D
Disclosure: I am part of Trade Nation's Influencer program and receive a monthly fee for using their TradingView charts in my analysis.
✅LIKE AND COMMENT MY IDEAS✅

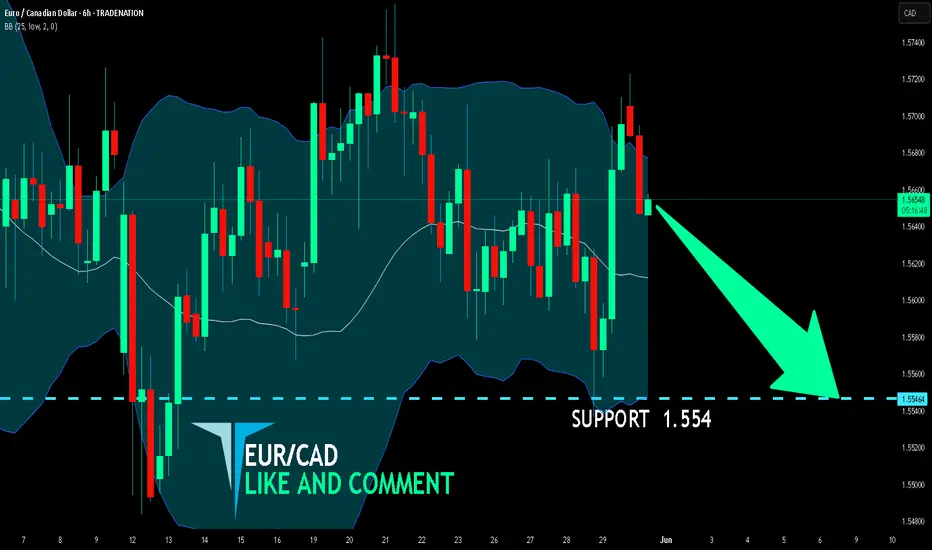
EUR/CAD BEARS ARE STRONG HERE|SHORT
Hello, Friends!
EUR/CAD pair is trading in a local uptrend which we know by looking at the previous 1W candle which is green. On the 6H timeframe the pair is going up too. The pair is overbought because the price is close to the upper band of the BB indicator. So we are looking to sell the pair with the upper BB line acting as resistance. The next target is 1.554 area.
Disclosure: I am part of Trade Nation's Influencer program and receive a monthly fee for using their TradingView charts in my analysis.
✅LIKE AND COMMENT MY IDEAS✅
GBPJPY - Bearish Control, Again!Hello TradingView Family / Fellow Traders. This is Richard, also known as theSignalyst.
📉As per our last GBPJPY analysis (attached on the chart), it rejected the upper red trendline and traded lower.
What's next?
GBPJPY is currently retesting the upper bound of the falling red channel again.
Moreover, the green zone is a strong structure and resistance.
🏹 Thus, the highlighted red circle is a strong area to look for sell setups as it is the intersection of structure and upper red trendline acting as a non-horizontal resistance.
📚 As per my trading style:
As #GBPJPY is around the red circle zone, I will be looking for bearish reversal setups (like a double top pattern, trendline break , and so on...)
📚 Always follow your trading plan regarding entry, risk management, and trade management.
Good luck!
All Strategies Are Good; If Managed Properly!
~Rich
Disclosure: I am part of Trade Nation's Influencer program and receive a monthly fee for using their TradingView charts in my analysis.

Inverted Head and Shoulders Pattern Bitcoin first bearish pattern i've seen inverted head and shoulders pattern! $94,000 possible then a run in December! for Bitcoin

USDJPY Faces An Intraday Corrective RecoveryUSDJPY Faces An Intraday Corrective Recovery after a bearish impulse, which can later send the price lower from technical and Elliott wave pespective.
USDJPY is sharply bouncing after reaching May lows within the wedge pattern for wave »v« of an impulse, so it can be now trading in a higher degree abc correction, which can recover the price back to 145 – 146 resistance area before bears return.
Basic bearish Elliott wave pattern shows that a five-wave impulsive decline indicates for more weakness after a corrective three-wave pause.

EUR/GBP BEARS ARE GAINING STRENGTH|SHORT
EUR/GBP SIGNAL
Trade Direction: short
Entry Level: 0.860
Target Level: 0.843
Stop Loss: 0.872
RISK PROFILE
Risk level: medium
Suggested risk: 1%
Timeframe: 1D
Disclosure: I am part of Trade Nation's Influencer program and receive a monthly fee for using their TradingView charts in my analysis.
✅LIKE AND COMMENT MY IDEAS✅

EU Prints Three Black Crows!FX:EURUSD has printed a strong Triple Candlestick Pattern called Three Black Crows after having made a 50% Retracement of the failed Higher High @ 1.1407.
This 50% Retracement found price testing a Previous Low and Resistance Zone where price now has broken a Previous Level of Structure being Support and is now on its way up to Retest this Break!
If Price is able to Retrace back to the Level of Structure @ ( 1.1336 - 1.1340 ) and shows signs of Resistance, this could deliver Short opportunities to take Price down to the Next Levels of Support @ 1.131 & 1.126!

SELL DXYThis week the USD has been retracing, most traders are going long but we know how this goes. Based of our strategy and approach we are still very much bearish on the USD. Our positions for shorts are at 99.916 and adding more shorts at 100.500. Our targets remain at 94.760. If you are catching this set up now then your stops should be above 1011.300. Use proper risk management and risk what you can afford to loose. Best of luck folks.

BTC in Bearish Wedge _ Breakdown or Bonus at Demand Zone?🔍 Technical Breakdown:
Bitcoin is currently trading within a *bearish wedge pattern* on the 1H timeframe. Price action is compressing, indicating a potential breakout soon.
⚠ *Bearish Bias:*
If the rising support breaks down, we expect a move toward the *103,000–102,000 support zone*, which has previously acted as strong demand.
📉 *RSI* is trending lower, showing weakening momentum.
📉 *MACD* crossover favors sellers (if applicable).
📌 Watch for reaction in the *reversal zone* to assess bounce or continuation.
---
📊 *Key Levels:*
- Resistance: 108,800 – 109,200
- Support Zone: 103,000 – 102,000
- Reversal Area: 102,000 – 101,800
---
📌 *Trade Plan:*
- Bearish bias below wedge
- Neutral bias inside wedge
- Bullish if price breaks and holds above wedge top
---
💬 Let me know your thoughts below.
🔁 Like, Comment & Follow for more clean setups!
---
📍This is for educational purposes only. Not financial advice.

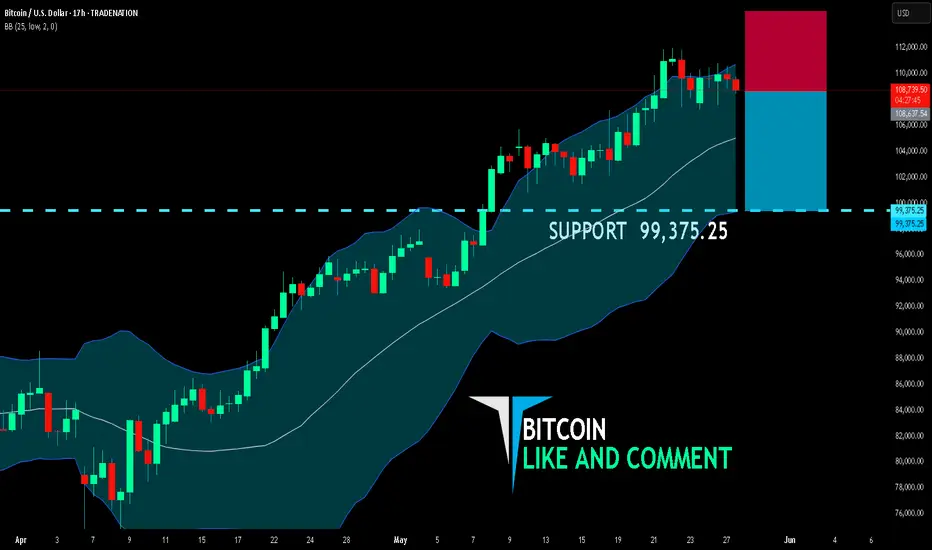
BITCOIN SELLERS WILL DOMINATE THE MARKET|SHORT
BITCOIN SIGNAL
Trade Direction: short
Entry Level: 108,637.54
Target Level: 99,375.25
Stop Loss: 114,788.84
RISK PROFILE
Risk level: medium
Suggested risk: 1%
Timeframe: 17h
Disclosure: I am part of Trade Nation's Influencer program and receive a monthly fee for using their TradingView charts in my analysis.
✅LIKE AND COMMENT MY IDEAS✅
USD/JPY BEARISH BIAS RIGHT NOW| SHORT
USD/JPY SIGNAL
Trade Direction: short
Entry Level: 144.107
Target Level: 141.877
Stop Loss: 145.579
RISK PROFILE
Risk level: medium
Suggested risk: 1%
Timeframe: 6h
Disclosure: I am part of Trade Nation's Influencer program and receive a monthly fee for using their TradingView charts in my analysis.
✅LIKE AND COMMENT MY IDEAS✅

GBP/USD BEST PLACE TO SELL FROM|SHORT
Hello, Friends!
The BB upper band is nearby so GBP-USD is in the overbought territory. Thus, despite the uptrend on the 1W timeframe I think that we will see a bearish reaction from the resistance line above and a move down towards the target at around 1.334.
Disclosure: I am part of Trade Nation's Influencer program and receive a monthly fee for using their TradingView charts in my analysis.
✅LIKE AND COMMENT MY IDEAS✅

EUR/USD BEARS ARE STRONG HERE|SHORT
Hello, Friends!
Bearish trend on EUR/USD, defined by the red colour of the last week candle combined with the fact the pair is overbought based on the BB upper band proximity, makes me expect a bearish rebound from the resistance line above and a retest of the local target below at 1.104.
Disclosure: I am part of Trade Nation's Influencer program and receive a monthly fee for using their TradingView charts in my analysis.
✅LIKE AND COMMENT MY IDEAS✅
