BEWARE! ⇅ ADA may go up or down or straightBased on my charts, We may see some downside but ADA may also see upside. Ultimately, I predict ADA will have a new price in July. I would recommend buying if you are bullish and selling if you are bearish, otherwise HODL.
I am not a financial advisor.
Bearish Patterns

UJ ANALYSISOverall price is bearish but has been on a bullish run as of recent. Price rejected off daily resistance and formed an H4 LH. So price could definitely transition to bearish. Also, it's a minor head & shoulders so if price break the neckline, look for sells.

USOIL BEST PLACE TO SELL FROM|SHORT
USOIL SIGNAL
Trade Direction: short
Entry Level: 61.86
Target Level: 55.95
Stop Loss: 65.80
RISK PROFILE
Risk level: medium
Suggested risk: 1%
Timeframe: 1D
Disclosure: I am part of Trade Nation's Influencer program and receive a monthly fee for using their TradingView charts in my analysis.
✅LIKE AND COMMENT MY IDEAS✅

CAD/JPY BEARS ARE STRONG HERE|SHORT
Hello, Friends!
We are going short on the CAD/JPY with the target of 101.132 level, because the pair is overbought and will soon hit the resistance line above. We deduced the overbought condition from the price being near to the upper BB band. However, we should use low risk here because the 1W TF is green and gives us a counter-signal.
Disclosure: I am part of Trade Nation's Influencer program and receive a monthly fee for using their TradingView charts in my analysis.
✅LIKE AND COMMENT MY IDEAS✅

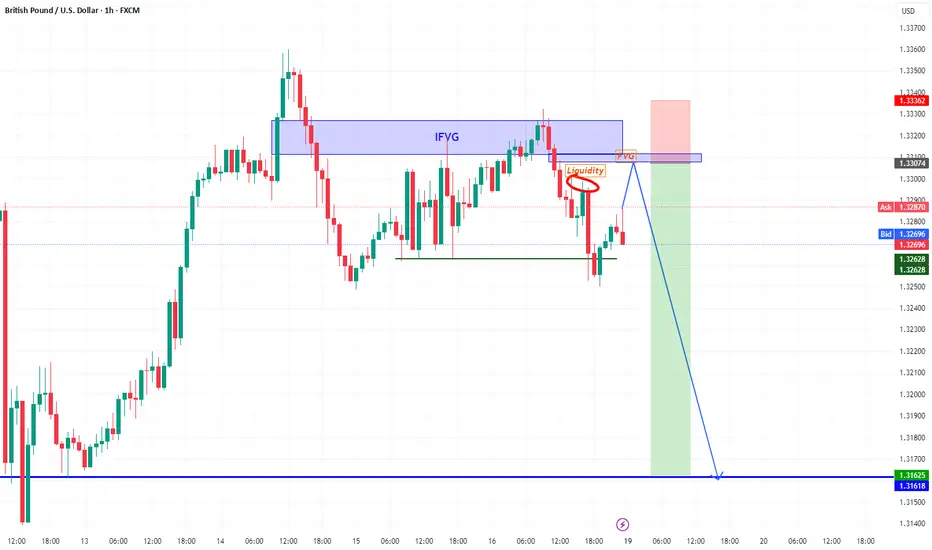
GBPUSD Bearish The main trend is down. The price rebounded from IFVG. We are waiting for a liquidity sweep and rebound from FVG.
Target 1.3162
US100 SHORT FROM RESISTANCE
US100 SIGNAL
Trade Direction: short
Entry Level: 21,312.4
Target Level: 19,338.7
Stop Loss: 22,625.1
RISK PROFILE
Risk level: medium
Suggested risk: 1%
Timeframe: 1D
Disclosure: I am part of Trade Nation's Influencer program and receive a monthly fee for using their TradingView charts in my analysis.
✅LIKE AND COMMENT MY IDEAS✅

AUD/JPY BEARS WILL DOMINATE THE MARKET|SHORT
Hello, Friends!
We are now examining the AUD/JPY pair and we can see that the pair is going up locally while also being in a uptrend on the 1W TF. But there is also a powerful signal from the BB upper band being nearby, indicating that the pair is overbought so we can go short from the resistance line above and a target at 88.446 level.
Disclosure: I am part of Trade Nation's Influencer program and receive a monthly fee for using their TradingView charts in my analysis.
✅LIKE AND COMMENT MY IDEAS✅

GBP/CAD SENDS CLEAR BEARISH SIGNALS|SHORT
Hello, Friends!
It makes sense for us to go short on GBP/CAD right now from the resistance line above with the target of 1.836 because of the confluence of the two strong factors which are the general downtrend on the previous 1W candle and the overbought situation on the lower TF determined by it’s proximity to the upper BB band.
Disclosure: I am part of Trade Nation's Influencer program and receive a monthly fee for using their TradingView charts in my analysis.
✅LIKE AND COMMENT MY IDEAS✅

BITCOIN BEARS ARE GAINING STRENGTH|SHORT
BITCOIN SIGNAL
Trade Direction: short
Entry Level: 103,219.31
Target Level: 92,838.77
Stop Loss: 110,139.67
RISK PROFILE
Risk level: medium
Suggested risk: 1%
Timeframe: 1D
Disclosure: I am part of Trade Nation's Influencer program and receive a monthly fee for using their TradingView charts in my analysis.
✅LIKE AND COMMENT MY IDEAS✅

GBP/JPY SELLERS WILL DOMINATE THE MARKET|SHORT
GBP/JPY SIGNAL
Trade Direction: short
Entry Level: 193.409
Target Level: 190.219
Stop Loss: 195.512
RISK PROFILE
Risk level: medium
Suggested risk: 1%
Timeframe: 1D
Disclosure: I am part of Trade Nation's Influencer program and receive a monthly fee for using their TradingView charts in my analysis.
✅LIKE AND COMMENT MY IDEAS✅

GBP/AUD BEST PLACE TO SELL FROM|SHORT
Hello, Friends!
GBP/AUD is trending down which is obvious from the red colour of the previous weekly candle. However, the price has locally surged into the overbought territory. Which can be told from its proximity to the BB upper band. Which presents a great trend following opportunity for a short trade from the resistance line above towards the demand level of 2.047.
Disclosure: I am part of Trade Nation's Influencer program and receive a monthly fee for using their TradingView charts in my analysis.
✅LIKE AND COMMENT MY IDEAS✅

EUR/JPY BEARISH BIAS RIGHT NOW| SHORT
Hello, Friends!
We are going short on the EUR/JPY with the target of 163.215 level, because the pair is overbought and will soon hit the resistance line above. We deduced the overbought condition from the price being near to the upper BB band. However, we should use low risk here because the 1W TF is green and gives us a counter-signal.
Disclosure: I am part of Trade Nation's Influencer program and receive a monthly fee for using their TradingView charts in my analysis.
✅LIKE AND COMMENT MY IDEAS✅

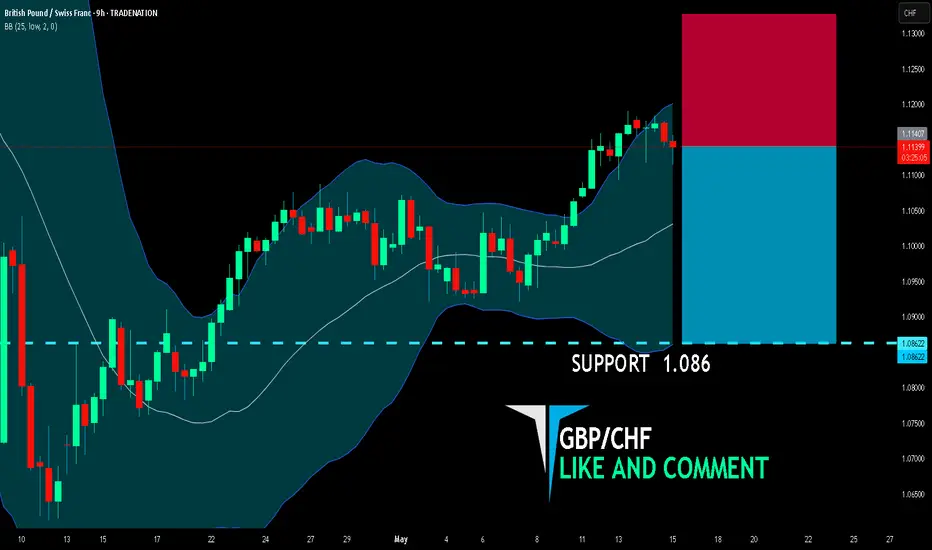
GBP/CHF SHORT FROM RESISTANCE
GBP/CHF SIGNAL
Trade Direction: short
Entry Level: 1.114
Target Level: 1.086
Stop Loss: 1.132
RISK PROFILE
Risk level: medium
Suggested risk: 1%
Timeframe: 9h
Disclosure: I am part of Trade Nation's Influencer program and receive a monthly fee for using their TradingView charts in my analysis.
✅LIKE AND COMMENT MY IDEAS✅
EUR/NZD SENDS CLEAR BEARISH SIGNALS|SHORT
Hello, Friends!
EUR/NZD pair is trading in a local downtrend which know by looking at the previous 1W candle which is red. On the 5H timeframe the pair is going up. The pair is overbought because the price is close to the upper band of the BB indicator. So we are looking to sell the pair with the upper BB line acting as resistance. The next target is 1.891 area.
Disclosure: I am part of Trade Nation's Influencer program and receive a monthly fee for using their TradingView charts in my analysis.
✅LIKE AND COMMENT MY IDEAS✅

SILVER BEARS ARE STRONG HERE|SHORT
SILVER SIGNAL
Trade Direction: short
Entry Level: 3,303.1
Target Level: 3,253.1
Stop Loss: 3,336.4
RISK PROFILE
Risk level: medium
Suggested risk: 1%
Timeframe: 2h
Disclosure: I am part of Trade Nation's Influencer program and receive a monthly fee for using their TradingView charts in my analysis.
✅LIKE AND COMMENT MY IDEAS✅

GOLD - Bearish Double TOPHello Traders !
The GOLD failed to create a new higher high !
The price formed a double top pattern.
Currently, The neckline is broken !
So, I expect a bearish move📉
________________
TARGET: 3022🎯

An Unharmonious Outlook for the New WeekGold Bullish? Sure, go ahead, but let me explain where we are and so on... 🤔
1. Newswise 📰
Tariffwar:
Trade tensions between the U.S. and China have intensified following President Trump's tariff hikes. The U.S. increased tariffs on Chinese imports to 145%, while China retaliated with tariffs up to 125% on U.S. goods. Despite these escalations, both countries have engaged in high-level negotiations in Geneva, aiming to de-escalate the situation. However, a recent abrupt withdrawal by the Chinese delegation has cast doubt on the progress of these talks. Analysts caution that even if an agreement is reached, it may offer only temporary relief, leaving markets exposed to prolonged trade tensions.
Federal Reserve does not cut interest rates:
President Donald Trump has been vocal in his criticism of the Federal Reserve’s decision to keep interest rates unchanged, calling Fed Chair Jerome Powell a “fool” for not lowering them. 😡 Trump argues that with falling energy prices, stable employment, and low inflation, the Fed should cut rates to stimulate economic growth. 📉
The Federal Reserve, however, remains cautious. 🏦 Officials have expressed concerns that recent tariffs could increase inflation, making premature rate cuts risky. They emphasize the need for clearer economic data before making further policy adjustments. 🧐
In summary: While Trump pushes for immediate cuts to boost the economy, the Fed is taking a measured approach, prioritizing long-term stability over short-term political pressure. ⚖️
War in Ukraine remains tense:
Western leaders, alongside President Zelensky, are calling for a 30-day ceasefire starting May 12. Russia has shown a willingness to negotiate but demands an end to Western military aid — a condition firmly rejected. 🚨
Conclusion: The coming days will be critical. A ceasefire could open the door to new peace efforts. If rejected, expect tougher sanctions and further escalation. 💥
India–Pakistan Conflict:
Tensions between India and Pakistan have escalated sharply following a militant attack on Indian tourists in Kashmir on April 22, 2025. India responded with airstrikes, prompting mutual accusations of missile and drone attacks. 💣 Despite a U.S.-brokered ceasefire announced on May 10, violations followed within hours. Both countries, nuclear-armed, have mobilized troops along the Line of Control. ⚔️ Global powers — including the U.S., U.K., China, and G7 — have urged restraint and offered to mediate. 🌍
2. Technicalwise 📊
1h Timeframe – Bearish Anti-Gartley Pattern
15m Timeframe – Bearish Anti-Butterfly Pattern
That’s not a sign of gold being bullish in the short term. 🚫
Let’s take a look at RSI values across timeframes:
- 5m – 31 – Down ⬇️
- 15m – 37 – Down ⬇️
- 30m – 43 – Down ⬇️
- 1h – 45 – Down ⬇️
- 4h – 46 – Down ⬇️
- 1d – 55 – Up ⬆️
Interpretation of RSI Values 🧐
5m to 4h (31 to 46 – all “Down”)
→ These low RSI values (below 50) across short- to mid-term timeframes indicate ongoing selling pressure and downward momentum. Although not yet in oversold territory (<30), this still signals relative weakness. ⚠️
1d (55 – “Up”)
→ On the daily chart, the RSI is above 50 and rising, suggesting a possible trend reversal or early signs of recovery — a bullish signal over the longer term. 📈
Overall Meaning 🧠
This points to short-term weakness within a broader potential uptrend. The market is soft on lower timeframes — likely in correction or consolidation — while the daily chart begins to show strength. It's a classic pullback setup in an uptrend. 🔄
Possible Strategy Consideration 💡
If you're leaning bullish, look for reversal signals on the smaller timeframes to align entries with the daily trend — such as RSI divergences or breakouts above local resistance. 📊
My Bias 🤔
Bearish sentiment dominates in the short term. Over the next week, I aim to enter short positions targeting $3,200. 📉
If sentiment shifts or key news emerges, a target of $3,400 becomes more realistic. 🚀
-------------------------------------------------------------------------
This is just my personal market idea and not financial advice! 📢 Trading gold and other financial instruments carries risks – only invest what you can afford to lose. Always do your own analysis, use solid risk management, and trade responsibly.
Good luck and safe trading! 🚀📊

EURCAD - Bearish Double TOPHello Traders !
The EURCAD failed to break the resistance level (1.59934 - 1.59334).
The price formed a double top pattern.
Currently, The neckline is broken !
So, I expect a bearish move📉
________________
TARGET: 1.54350🎯

USOIL BEARS ARE GAINING STRENGTH|SHORT
USOIL SIGNAL
Trade Direction: short
Entry Level: 63.61
Target Level: 55.26
Stop Loss: 69.15
RISK PROFILE
Risk level: medium
Suggested risk: 1%
Timeframe: 1D
Disclosure: I am part of Trade Nation's Influencer program and receive a monthly fee for using their TradingView charts in my analysis.
✅LIKE AND COMMENT MY IDEAS✅

USD/CHF BEARS WILL DOMINATE THE MARKET|SHORT
Hello, Friends!
It makes sense for us to go short on USD/CHF right now from the resistance line above with the target of 0.820 because of the confluence of the two strong factors which are the general downtrend on the previous 1W candle and the overbought situation on the lower TF determined by it’s proximity to the upper BB band.
Disclosure: I am part of Trade Nation's Influencer program and receive a monthly fee for using their TradingView charts in my analysis.
✅LIKE AND COMMENT MY IDEAS✅

NVDA Weekly Head and Shoulders There's no main price target in mind, however the company from a risk management perspective has been largely not investible for about a year. Multiple 40-60% moves from top to the bottom of the range. Now with diffusion global competition will eventually eat into Nvidia's earnings/market share.
Without a major wave of monetary inflation in the United States it's very like that the short/medium term top has been put in and AI is a narrative that is played out. AI although impressive has yet to deliver what people see has a true life changer. It will eventually happen but Nvidia will have competition when that occurs.

USD/CAD SHORT FROM RESISTANCE
USD/CAD SIGNAL
Trade Direction: short
Entry Level: 1.398
Target Level: 1.366
Stop Loss: 1.420
RISK PROFILE
Risk level: medium
Suggested risk: 1%
Timeframe: 1D
Disclosure: I am part of Trade Nation's Influencer program and receive a monthly fee for using their TradingView charts in my analysis.
✅LIKE AND COMMENT MY IDEAS✅

AUD/USD BEARS WILL DOMINATE THE MARKET|SHORT
Hello, Friends!
It makes sense for us to go short on AUD/USD right now from the resistance line above with the target of 0.638 because of the confluence of the two strong factors which are the general downtrend on the previous 1W candle and the overbought situation on the lower TF determined by it’s proximity to the upper BB band.
Disclosure: I am part of Trade Nation's Influencer program and receive a monthly fee for using their TradingView charts in my analysis.
✅LIKE AND COMMENT MY IDEAS✅
