BITCOIN BEARS WILL DOMINATE THE MARKET|SHORT
BITCOIN SIGNAL
Trade Direction: short
Entry Level: 85,125.88
Target Level: 75,647.52
Stop Loss: 91,444.78
RISK PROFILE
Risk level: medium
Suggested risk: 1%
Timeframe: 1D
Disclosure: I am part of Trade Nation's Influencer program and receive a monthly fee for using their TradingView charts in my analysis.
✅LIKE AND COMMENT MY IDEAS✅
Bearish Patterns

NZD/CAD SENDS CLEAR BEARISH SIGNALS|SHORT
NZD/CAD SIGNAL
Trade Direction: short
Entry Level: 0.826
Target Level: 0.804
Stop Loss: 0.840
RISK PROFILE
Risk level: medium
Suggested risk: 1%
Timeframe: 9h
Disclosure: I am part of Trade Nation's Influencer program and receive a monthly fee for using their TradingView charts in my analysis.
✅LIKE AND COMMENT MY IDEAS✅

AUD/CAD BEARS ARE GAINING STRENGTH|SHORT
Hello, Friends!
AUD/CAD pair is trading in a local uptrend which we know by looking at the previous 1W candle which is green. On the 1H timeframe the pair is going up too. The pair is overbought because the price is close to the upper band of the BB indicator. So we are looking to sell the pair with the upper BB line acting as resistance. The next target is 0.882 area.
Disclosure: I am part of Trade Nation's Influencer program and receive a monthly fee for using their TradingView charts in my analysis.
✅LIKE AND COMMENT MY IDEAS✅

EUR/NZD SENDS CLEAR BEARISH SIGNALS|SHORT
EUR/NZD SIGNAL
Trade Direction: short
Entry Level: 1.922
Target Level: 1.903
Stop Loss: 1.934
RISK PROFILE
Risk level: medium
Suggested risk: 1%
Timeframe: 1h
Disclosure: I am part of Trade Nation's Influencer program and receive a monthly fee for using their TradingView charts in my analysis.
✅LIKE AND COMMENT MY IDEAS✅

AUDJPY Breakout and Potential RetraceHey Traders, in today's trading session we are monitoring AUDJPY for a selling opportunity around 91.800 zone, AUDJPY is trading in a downtrend and currently is in a correction phase in which it is approaching the trend at 91.800 support and resistance area.
Trade safe, Joe.

NZDJPY is Approaching The Daily TrendHey Traders, in today's trading session we are monitoring NZDJPY for a selling opportunity around 86.000 zone, NZDJPY is trading in a downtrend and currently is in a correction phase in which it is approaching the trend at 86.000 support and resistance area.
Trade safe, Joe.

ETHUSDT – Eyeing a Potential Rejection Near 1650 ResistanceEthereum is currently in a downtrend, and the recent upward move appears to be part of a correctional phase. Price is now approaching the descending trendline and a key resistance area around $1650, which previously acted as support.
This zone could serve as a potential rejection area, especially if the broader bearish structure holds.

BTCUSDT – Watching for a Potential Short Near 87KBitcoin is currently trading within a broader downtrend, and the recent bullish move appears to be a correctional phase within that structure. Price is approaching a key resistance zone around $87,000, which aligns with the descending trendline and a previous support-turned-resistance level.
This confluence zone could act as a strong rejection area, offering a potential selling opportunity if bearish confirmation is seen. I’ll be watching for reversal signals (e.g., bearish candlestick patterns, momentum divergence) around that level to validate a short setup.

NAS100 Will Move Lower! Sell!
Here is our detailed technical review for NAS100.
Time Frame: 45m
Current Trend: Bearish
Sentiment: Overbought (based on 7-period RSI)
Forecast: Bearish
The market is trading around a solid horizontal structure 18,546.2.
The above observations make me that the market will inevitably achieve 18,341.2 level.
P.S
Please, note that an oversold/overbought condition can last for a long time, and therefore being oversold/overbought doesn't mean a price rally will come soon, or at all.
Disclosure: I am part of Trade Nation's Influencer program and receive a monthly fee for using their TradingView charts in my analysis.
Like and subscribe and comment my ideas if you enjoy them!

GOLD BEARISH BIAS RIGHT NOW| SHORT
GOLD SIGNAL
Trade Direction: short
Entry Level: 3,329.23
Target Level: 3,122.55
Stop Loss: 3,466.98
RISK PROFILE
Risk level: medium
Suggested risk: 1%
Timeframe: 12h
Disclosure: I am part of Trade Nation's Influencer program and receive a monthly fee for using their TradingView charts in my analysis.
✅LIKE AND COMMENT MY IDEAS✅

NZD/JPY BEST PLACE TO SELL FROM|SHORT
NZD/JPY SIGNAL
Trade Direction: short
Entry Level: 84.696
Target Level: 82.624
Stop Loss: 86.074
RISK PROFILE
Risk level: medium
Suggested risk: 1%
Timeframe: 8h
Disclosure: I am part of Trade Nation's Influencer program and receive a monthly fee for using their TradingView charts in my analysis.
✅LIKE AND COMMENT MY IDEAS✅

EUR/CHF SHORT FROM RESISTANCE
Hello, Friends!
The BB upper band is nearby so EUR-CHF is in the overbought territory. Thus, despite the uptrend on the 1W timeframe I think that we will see a bearish reaction from the resistance line above and a move down towards the target at around 0.923.
Disclosure: I am part of Trade Nation's Influencer program and receive a monthly fee for using their TradingView charts in my analysis.
✅LIKE AND COMMENT MY IDEAS✅

NASDAQ Potential DownsidesHey Traders, in today's trading session we are monitoring NAS100 for a selling opportunity around 19200 zone, NASDAQ is trading in a downtrend and currently is in a correction phase in which it is approaching the trend at 19200 support and resistance area.
Trade safe, Joe.

EURJPY Potential DownsidesHey Traders, in today's trading session we are monitoring EURJPY for a selling opportunity around 162.100 zone, EURJPY is trading in a downtrend and currently is in a correction phase in which it is approaching the trend at 162.100 support and resistance area.
Trade safe, Joe.

EUR/CAD SELLERS WILL DOMINATE THE MARKET|SHORT
Hello, Friends!
EUR-CAD uptrend evident from the last 1W green candle makes short trades more risky, but the current set-up targeting 1.562 area still presents a good opportunity for us to sell the pair because the resistance line is nearby and the BB upper band is close which indicates the overbought state of the EUR/CAD pair.
Disclosure: I am part of Trade Nation's Influencer program and receive a monthly fee for using their TradingView charts in my analysis.
✅LIKE AND COMMENT MY IDEAS✅

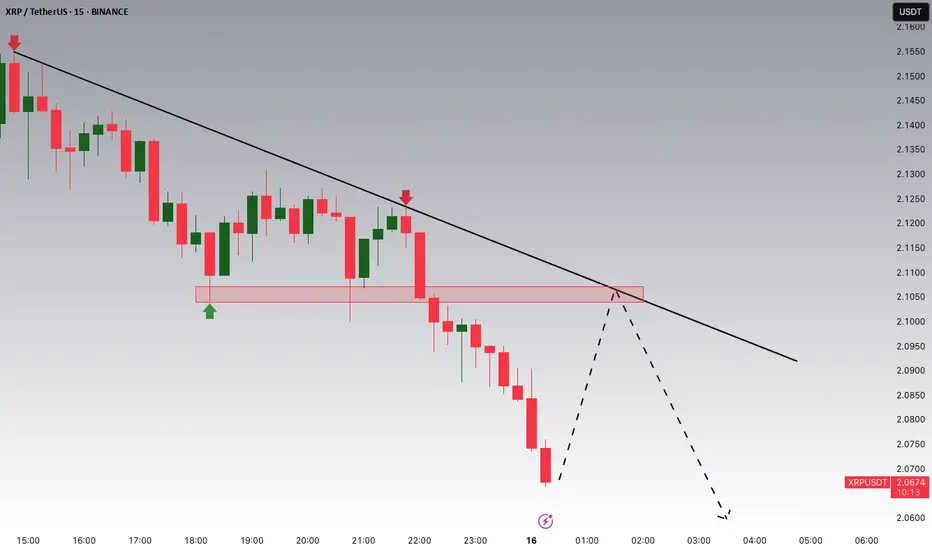
Watching $2.10 for a Potential XRP ReversalRipple (XRP) is currently trading within a clear downtrend, and we’re now seeing a corrective move that’s pushing price back toward a key zone around $2.10, which has acted as both support and resistance in the past.
This area aligns closely with the descending trendline, making it a strong confluence zone to watch for a potential bearish reaction.
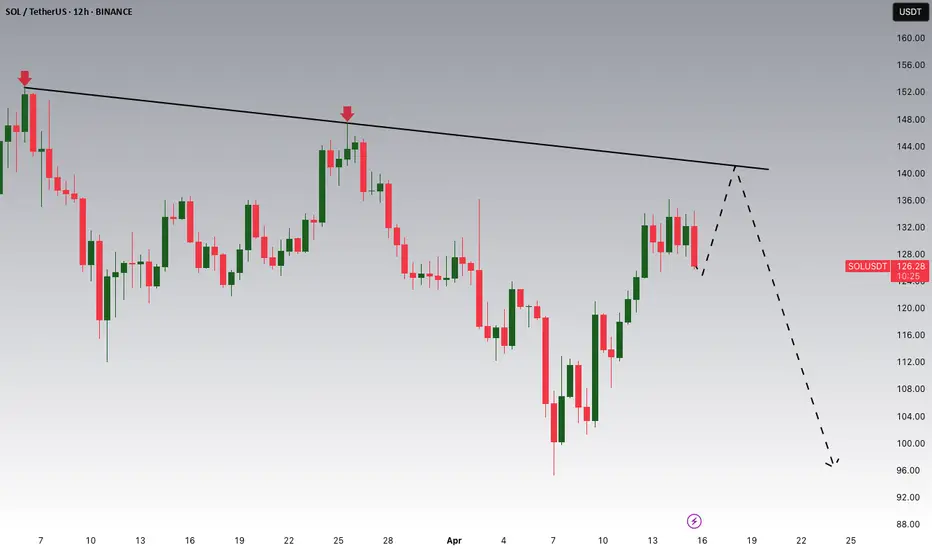
Solana Potential DownsidesHey Traders, in today's trading session we are monitoring Solana for a selling opportunity around 140 zone, SOLUSDT is trading in a downtrend and currently is in a correction phase in which it is approaching the trend at 140 support and resistance area.
Trade safe, Joe.
EURGBP Potential downsidesHey Traders, in today's trading session we are monitoring EURGBP for a selling opportunity around 0.86000 zone, EURGBP is trading in a downtrend and currently is in a correction phase in which it is approaching the trend at 0.86000 support and resistance area.
Trade safe, Joe.

SILVER BEARISH BIAS RIGHT NOW| SHORT
SILVER SIGNAL
Trade Direction: short
Entry Level: 3,225.6
Target Level: 3,081.7
Stop Loss: 3,321.8
RISK PROFILE
Risk level: medium
Suggested risk: 1%
Timeframe: 6h
Disclosure: I am part of Trade Nation's Influencer program and receive a monthly fee for using their TradingView charts in my analysis.
✅LIKE AND COMMENT MY IDEAS✅

EURJPY TO BREAK 2022 LOWThe ascending channel is the first sign that indicates that price have a high chance to break 2022 low. After price impulsively broke the channel price formed a continuation of which I expect an impulsive break to the downside.

Gold Potential DownsidesHey Traders, in today's trading session we are monitoring XAUUSD for a selling opportunity around 3220 zone, Gold is trading in a downtrend and currently is in a correction phase in which it is approaching the trend at 3220 support and resistance area.
Trade safe, Joe.

Bitcoin Potential DownsidesHey traders, in today's trading session we are monitoring Bitcoin for a selling opportunity around 86k zone, BTCUSDT is trading in a downtrend and currently is in a correction phase in which it is approaching the trend at 86k support and resistance area.
Trade safe, Joe.

USDJPY Is Nearing An Important Resistance Under a Strong JPYHey Traders, in today's trading session we are monitoring USDJPY for a selling opportunity around 144.100 zone, USDJPY is trading in a downtrend and currently is in a correction phase in which it is approaching the trend at 144.100 resistance area.
Trade safe, Joe.
