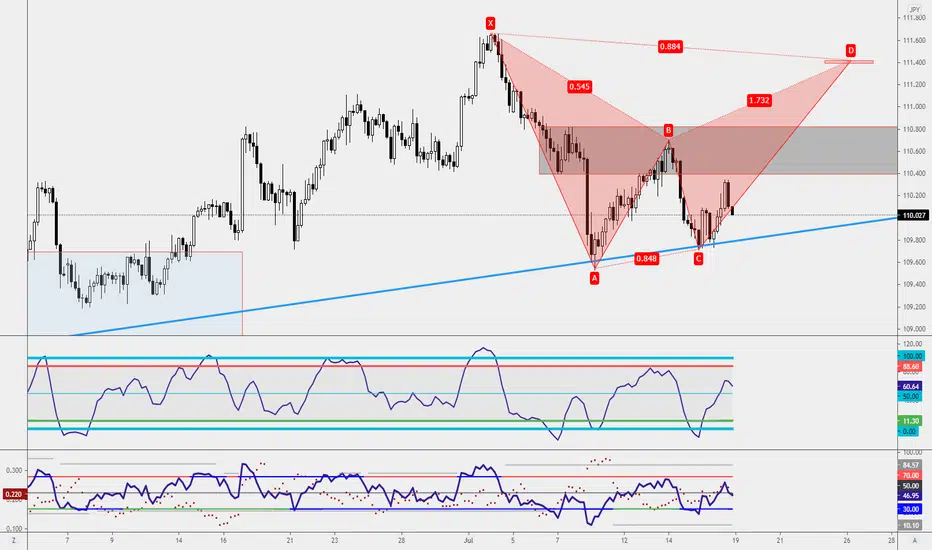
Short 🩸 Blood Bat Drinks Bull BloodShort 🩸 Blood Bat Drinks Bull Blood
"Did you think you've won?"
Key points:
- Left-wing of the Blood Bat functioned as a Bullish Pennant chart pattern
- Right-wing of the Blood Bat functioned as a Bearish Pennant technical analysis pattern
- The Body of the Blood Bat made people imagine Head & Shoulders
It's not Head & Shoulders, nor a bull run.
The Blood Bat drinks the blood of bulls and bears alike.
Bearish Bat

SGDMYR XEOn 29Jul21, Malaysia Ringgit has retested the previous low at 3.1348, which means 1SGD exchange for 3.1348MYR.
If you are earning SGD and spending MYR, it is a good time to consider changing most of your expenses for the next few months to MYR because it is at its recent historical low.
There is a high possibility that SGD may weaken against MYR or MYR may strengthen against SGD, in any way it is 60% unlikely that SGDMYR to go beyond(higher) than 3.1348MYR provided there isn't more shock to the market on Malaysia Political scene.
If you are looking to short SGDMYR, just check if the spread is too much, if the spread is more than 5pips, it's too much.

Bearish Gartley Becomes Logscale BatThe bearish Gartley on ETH has evolved to form a Logscale Bearish Bat

BAT POSSIBLE TO 1 USD - INTERESTING SIGNALS AND TRAGETS ETN TOOLHello trading friends,
Bat could enter a new breakout and new increase to 1 USD + depend on the last data.
There are some interesting targets on BAT that show a possible increase trend.
We know #BAT as one of the best coins that have whale fan data. it means whales hold it by DCA for the long term, and from this period BAT looks to have a good healthy increase trend to 1 USD + we will follow coming time this data as this coin looks interesting
✅Like and subscribe to not miss a new idea!✅ Thank you
# Manage always your risk, nobody knows the future - all depending on Data, trends, and whale effect
All our charts are not advice and you are responsible for your own investment

30 Minute bearish Bat PCZ Approaches: RSI Will Be OverboughtRSI will likely be overbought by the time we reach the PCZ i will be preparing to enter my position when it gets there.

ZEEL - Two Bearish PatternsZeel has Butterfly and Bat at daily timeframe. most probably butterfly prz will work i.e.220.30 Target on chart...

Double ABCD Competition on QuaterpointThe crosover point sent the price up, there was rejection from the quaterpoint and pattern completion, now we see a bat pattern forming, i"m going to wait for this to drop to the 886 before waiting for rejection and the potentially taking long!
(I may also scalp back down to the 886)

USDJPY-Weekly Market Analysis-Jul21,Wk4While there are a lot of trading opportunities using the Harmonic Patterns on USDJPY, but what actually standout will be the trendline buying opportunity. As long as the market didn't break and close below the 4-hourly chart's trendline(to be more precise, not to close below 109.53), I will be looking for a buying opportunity on this pair and my 1st target will be at 110.63. That is also the level that I'll be shifting my stop-loss to entry{SLE}.

Bitcoin Analyze (Triple Three Corrections) !!!hello, I have to say thanks to all users that respect ideas that are even wrong (Please Respect each other🙏).
Bitcoin Analyze ( BTCUSDT ) Timeframe 4h ⏰
First, I have to say sorry for the busy chart, but I suggest to you please spend some minutes on this post, probably useful (This is just my idea).
Location🌊 : Bitcoin's Correction has started around 64200$ (The Corrective structure is Zig Zag 5-3-5). I believed that microwave 4 of main wave C ended at 41330$ == Microwave 4 was like Descending Triangle, but when the upper line of Descending Triangle has broken yesterday, as I said in my previous post ''If price breaks our triangle (to up), probably microwave 4 will be the Triple Three Corrections type (WXYXZ)''. now, we lost Triangle and I think that we have a Triple Three Corrections.
What is my aim 🎯? Answer: I want to find the end of microwave 4 of main wave C or where will microwave 5 of main wave C start ?!
I want to say some of the necessary concepts for Triple Three Corrections and then compare them with our chart's conditions (Let's go):
The corrective structures are labeled as WXYXZ . The corrective structures are labeled as WXYXZ. They are an 11 swing structure. The subdivision of wave W, wave Y, and wave Z can be a zigzag, a flat, a double three of smaller degree, or a triple three of smaller degree. The Wave X can be any corrective structure including a stand-alone triangle.
The Fibonacci ratio relationships are as follows. Wave X will retrace anywhere from 50%, 61.8%, 78.6%, or 88.6% of wave W.Wave Y can not pass 161.8% of wave W or it can become an impulsive wave three. The second wave X will retrace the wave Y in the same aforementioned Fibonacci retracement levels as it did the wave W. The second wave X structure does not have be the same structure as the first wave X. The Wave Z target area to finish the triple three correction will be a Fibonacci extension 61.8%, 100%, or 123.6% of the wave W.
one of the standard templates of three corrective structure combinations that can form triple three corrections == this particular one is a double three wave W followed by the first wave X being a zigzag. Likewise as the wave W, the wave Y is a double three. This is followed by a zigzag second wave X connector. The wave Z ends with another double three.
now I want to compare my chart with upper conditions:
The corrective structures are labeled as WXYXZ . They are an 11 swing structure== I was able to find 10 swing structures and I think that we are on the eleventh swing (Wave (Z)).
The subdivision of wave W, wave Y, and wave Z can be a zigzag, a flat, a double three of smaller degree, or a triple three of smaller degree. The Wave X can be any corrective structure including a stand-alone triangle == our waves have these shapes.
Wave W is a double three Wave == the wave (W) is a double three Wave✅ // Any three ✅
Wave X will retrace anywhere from 50%, 61.8%, 78.6%, or 88.6% of wave W == Wave (X1) has complied.✅
Wave Y can not pass 161.8% of wave W or it can become an impulsive wave three == Wave (Y) has complied. ✅// The wave (Y) is a double three Wave✅
Wave X will retrace anywhere from 50%, 61.8%, 78.6%, or 88.6% of wave Y == Wave (X2) Has retraced 161.8%, t Has not complied but I am talking about the standard template ❌ //Any three ✅
The second wave X(X2) structure does not have be the same structure as the first wave X (X1) == This item has complied ✅
The Wave Z target area to finish the triple three correction will be a Fibonacci extension 61.8%, 100%, or 123.6% of the wave W.== The wave (Z) ends with another double three.// My aim 🎯
If you read my explanation carefully, you will know that my counting waves are really close to one of the standard templates of three corrective structure combinations that can form triple three corrections.
Where is the end of Wave (Z) ?!
My idea : Structure of Wave ( Z ) is ( Flat 3-3-5 ), and I think that we are on microwave C of microwave ((Y)) of Wave (Z). Wave C terminates just slightly beyond the end of wave A at around 113% to 127.2% (Standard).
The End of wave C or the End of Wave ( Z ) ( End of Main Wave 4 == My aim 🎯 ) :
Target 1: 36370$ == (113% Wave A) // 37320$ (127.2% Wave A ) // 37555$ is Yearly Resistance 1 .
Target 2: 41280$ until 40290$ ( Resistance + Cluster of Fibs+ Topline of the upper channel + upeer line of Bearish 🦇Bat🦇 Harmonic Pattern ( we have this pattern on this zone) )
Support zone: 31620$ until 30960$ ( Support + Cluster of Fibs+ the lower line of Descending Triangle ) == Heavy & important Support
Also, still, I am believing in Bitcoin Long-term Analyze ( Monthly Time frame)📆: Please read this post carefully ( I ❤️LOVE❤️ THIS POST😀)👉https://www.tradingview.com/chart/BTCUSDT/PTviG7sS-Bitcoin-Long-term-Analyze-Monthly-Time-frame/
My Suggestion: please do NOT buy Coins for Midterm and Long-term investment until the market finds a way. Over 43780$ our counting waves will fail and we can think about buying coins. Thanks for reading this Long text🙏💐.
Do not forget to put Stop loss for your positions (For every position you want to open).
Please follow your strategy , this is just my idea, and I will be glad to see your ideas in this post.
Please do not forget the ✅ 'like' ✅ button 🙏😊 & Share it with your friends, Thanks, and Trade safe

NZDUSD - Bearish Bat checkbackA Bearish Bat Pattern has formed and I'm waiting for the market to retest 0.7080 for a shorting opportunity as a trend trading opportunity.

EURUSD-Weekly Market Analysis-Jul21,Wk1Well if you have missed the bearish shark shorting opportunity, you might not want to miss this Bearish Shark Pattern on the 1-hourly chart which has to form before 29Jun2021, 1am(+8GMT). If the candle fails to touch point D before the dateline, I will scrap this trading idea.
Lots of traders have complained that the market volatility has dropped, but we still managed to capture some great profits. Check my link(within TradingView at the bottom).
My student has spotted a shorting opportunity as well, leave your thoughts on which trading setup do you prefer, and why?

DASHBTC is testing the daily support 🦐DASHBTC is testing the daily support after an important bearish impulse. IF the price will lose the support, we can see another bearish impulse.
According to Plancton's strategy (check our Academy), we can set a nice order
–––––
Follow the Shrimp 🦐
Keep in mind.
🟣 Purple structure -> Monthly structure.
🔴 Red structure -> Weekly structure.
🔵 Blue structure -> Daily structure.
🟡 Yellow structure -> 4h structure.
⚫️ Black structure -> <4h structure.
Here is the Plancton0618 technical analysis, please comment below if you have any question.
The ENTRY in the market will be taken only if the condition of the Plancton0618 strategy will trigger.

USD/JPY Bearish Alt BatHere you can see USD/JPY is forming a bearish bat harmonic pattern. Waiting for the entire PRZ to be tested and open a short position.

S&P ILF ETF .... Heading South ?Nice well shaped Harmonic Bat formation.
Watch, let it get a head of downward stream and jump on.
The largest component of this ETF is VALE at 16%
As always do your own Due Diligence and respect overall market direction
Good Luck
S.

Short seems betterWe have double top pattern!we are seeing a pullback right now!short positions are more logical than longs!

EURNZD > Bearish Bat Pattern!!Analysis on #EURNZD
Hello friends.
Possible bat pattern near strong supply zone where the price fell sharply 275 pips,
I will keep an eye on this pattern for the D leg completion to enter a short trade
if this setup delivered value to you, like and comment
Check today analysis below⠀
>>“Markets are never wrong, but opinions often are.”
____________________________________________________________________________⠀
-Disclaimer: This information is not a recommendation to BUY or SELL. It is to be used for educational purposes only⠀
-Please note this is just a PREDICTION and I have no reason to act on it and neither should you

POTENTIAL SHORT BEARISH BAT H1TF POTENTIAL SHORT BEARISH BAT H1TF
*W4C IS THE BEST WAY TO ENTER
Abbreviations / Keywords:
LTF - Lower Time Frame
HTF - Higher Time Frame
TF - Time Frame
TRS - Trend Reversal Strategy
CRT - Counter-Retail Technique / Break-out
APF - Advance Pattern Formation
W4C - Waiting for Confirmation
LLCC - Lower low, lower close
HHHC - Higher high, higher close
SL - Stop loss
TP - Target Profit
POR - Point of Ruin
RRR - Risk Reward Ratio
Risk Disclaimer: This is not a trade signal hence we'll not be held responsible for any losses that will occur in your account during trading. You and you alone are responsible for deciding if you are comfortable accepting the potential risk involved in trading. So trade at your own risk and do not invest money you cannot afford to loss..

POTENTIAL SHORT BEARISH BAT H1TFPOTENTIAL SHORT BEARISH BAT H1TF
*W4C IS THE BEST WAY TO ENTER
Abbreviations / Keywords:
LTF - Lower Time Frame
HTF - Higher Time Frame
TF - Time Frame
TRS - Trend Reversal Strategy
CRT - Counter-Retail Technique / Break-out
APF - Advance Pattern Formation
W4C - Waiting for Confirmation
LLCC - Lower low, lower close
HHHC - Higher high, higher close
SL - Stop loss
TP - Target Profit
POR - Point of Ruin
RRR - Risk Reward Ratio
Risk Disclaimer: This is not a trade signal hence we'll not be held responsible for any losses that will occur in your account during trading. You and you alone are responsible for deciding if you are comfortable accepting the potential risk involved in trading. So trade at your own risk and do not invest money you cannot afford to loss..


Is NASDAQ Out of the Wood?Nasdaq along with other US stock indices has been recovering a big chunk of losses since last week.
However, obviously, we are not out of the wood, and if we ain't, do we sell or wait?
There's still a pretty good chance we see the market tank for a second time and one of the reasons is that the pullback is still well lesser than 10%.
If you go back and look at every major pullback up to early 2020, you would have realized every major pullback went well over 10%
Another consideration is the current fundamentals are different as well - we now have a serious risk of inflation while back then we don't and the market has a lot to pump the stock market with their stimmy checks from the Fed.
Right now, we are seeing a probably M formation in the making, a formation of a bearish bat completed and just nicely seated between the Fibo levels of 61.8% and 78.6%.
Well, this trading could go wrong as far as the stock market is concerned, I think we do have a valid trade setup to sell with low risk and high reward ratio.
Besides, the price is considerably high if we based on the entire range of the market as marked out with a channel.

NZDUSD > Bearish Harmonic Bat Pattern!!if your kind and generous leave a comment and like this post, it will really support the creation of more free ideas like this one for you
Analysis on #NZDUSD
Hello friends.
Here we have the market moving sideways, and we use when market doing so, we look for harmonics, and here we have a possible bearish harmonic bat pattern that might complete soon for a day trade.
Safe trading everyone
Check today analysis below⠀
>> “Do not anticipate and move without market confirmation.”
_____________________________________________________________________________⠀
-Disclaimer: This information is not a recommendation to BUY or SELL. It is to be used for educational purposes only⠀
-Please note this is just a PREDICTION and I have no reason to act on it and neither should you
