USDJPY-Weekly Market Analysis-Aug20,Wk4USDJPY has been very versatile there are many possibilities in this chart movement. A Bullish Shark on the 4-hourly chart, a Bearish Bat, a Bullish Deep Gartley on the 1-hourly chart.
As for now, I'm waiting for the Bearish Bat Pattern for shorting opportunity.
Well, why do I say this? Sometimes this is the truth about trading, many opportunities and there are various possibilities, it is important for us as traders to relinquished our ego and wait for trade confirmation before engaging the trade.
Bearish Bat

NZDUSD - 5-0 Pattern Grand PlanLast week the 5-0 Pattern was spotted and the trading opportunity was share in our group(link at the bottom).
The candlestick formation and RSI Overbought was not the only reason that triggers me to short the market, but also on the higher timeframe, the daily chart(right) has a bearish bat setup. Although, the bearish bat pattern has triggered alert of this trade is a No, No, I see there isn't any harm doing that as I'm getting a healthy RRR(Reward:Risk).
I had engaged the 5-0 pattern and plan for a 2 target approach, the second target that I am planning is no other than the Target1 of the bearish bat pattern.
But hey Rayn, I thought you were saying there's a warning sign on the bat pattern and you circle it in yellow?
Yes, having a warning sign means it's not ideal to engage the trade. However, I had an opportunity on a lower timeframe to engage it and I'm prepared to intervene in my second trade if the market shows the trend is going to reverse.
Let's see how this trade pans out, I have more plans to engage this trade. Follow us in our community and don't miss out another trading opportunity ever again.

BEARISH BAT PATTERNThis is an example of a bearish bat pattern
which could give you a big amount of pips
if you learn to identify them.

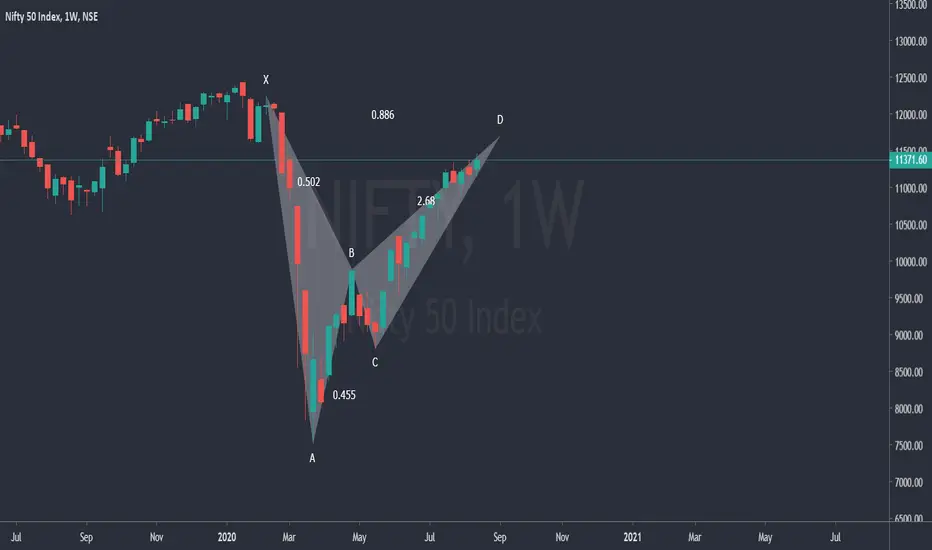
Bearish Bat in Nifty 50 Weekly time frame.Hello,
Bearish Bat in Nifty 50 Weekly time frame.
Note: This chart is only for reference and study purpose.
$LEND #LENDBTC #LEND ENDING CHANNEL / IT IS SCARY MOVIE :($LEND #LENDBTC #LEND ENDING CHANNEL / IT IS SCARY MOVIE :(

great selling opportunity. Bat pattern at structure highsA short bat pattern has completed at the 0.7228 level at structure highs. Price has continued to make higher highs indicated with the yellow line. A 2 candle doji was formed at the previous structure highs which shows a lot of resistance. If price retests resistance at 0.7234, I will enter short and look to take profit at 0.7154. stops will be above structure highs


ETH - - Bearish Bat formation Target is 269 to 200ETH - - Bearish Bat formation Target is 269 to 200
We could get rejected here. I don't know if we will or not but trade safe. Much love

FKLI TRADING : 129) still in the bracket 1605 - 1512this is trade 129 frm haidojo trading...
- the bearish bat pattern is somehow still valid..with range to short frm 1597-1605...SL a few points abv 1605...1st tp 1587,
2nd tp 1560
the tighter range is 1585 - 1560...and the TREND is still DOWNTREND...short on rebound is still valid...
higher resistance : 1598- 1605 red box and bearish bat pattern
current resistance : 1585
current support : 1547-1560
lower support : 1512-1520 green box and bullish cypher pattern
WARNING!
RISK DISCLAIMER : this is juz a trading idea...trading stocks, futures or forex might incur a huge risk to your account/funds…DON’T LOSE MONEY THAT YOU CANNOT AFFORD…any idea(s) of trading in this episode SHALL NOT be regarded as a hint of BUYING or SELLING. It is MERELY a trading journal and it has been used for educational purpose only… trade at your own risk!
**your "LIKE" and "FOLLOW" are my main source of motivation to continue posting more valuable contents...TQ**

FKLI TRADING : 124) BEARISH GARTLEY PATTERNthis is trade 124 frm haidojo trading...CLOSE ATTENTION to the :
- a possible bearish bat pattern formation in hourly chart...with range to short frm 1597-1605...SL a few points abv 1605...1st tp 1587,
2nd tp 1560
fkli-aug closing close to the 1585 resistance level tdy...
resistance : 1585- 1605 (the red colored rectangle )
support : 1547-1560
lower support : 1512-1520
WARNING!
RISK DISCLAIMER : this is juz a trading idea...trading stocks, futures or forex might incur a huge risk to your account/funds… DON’T LOSE MONEY THAT YOU CANNOT AFFORD …any idea(s) of trading in this episode SHALL NOT be regarded as a hint of BUYING or SELLING. It is MERELY a trading journal and it has been used for educational purpose only… trade at your own risk!
**your "LIKE" and "FOLLOW" are my main source of motivation to continue posting more valuable contents...TQ**


FKLI TRADING : 121) bracketing the market with advanced patternthis is trade 121 frm haidojo trading...2 messages here tdy...
1) a possible bearish bat pattern formation in hourly chart...with range to short frm 1597-1605...SL a few points abv 1605...1st tp 1587,
2nd tp 1560
2) lower level we have long-awaited bullish cypher pattern ranging frm 1512-1520...SL a few points below the 1500...1st tp 1560,
2nd tp 1587...
with these 2 possible advanced patterns, we successfully bracketing the market within the range of 1605 - 1500...and make a simple
call-to-action plan...
resistance : 1585- 1605 (the red colored rectangle )
support : 1547-1560
lower support : 1512-1520
WARNING!
RISK DISCLAIMER : this is juz a trading idea...trading stocks, futures or forex might incur a huge risk to your account/funds… DON’T LOSE MONEY THAT YOU CANNOT AFFORD …any idea(s) of trading in this episode SHALL NOT be regarded as a hint of BUYING or SELLING . It is MERELY a trading journal and it has been used for educational purpose only… trade at your own risk!
**your "LIKE" and "FOLLOW " are my main source of motivation to continue posting more valuable contents...TQ**


BPCL | LONG TRADEHey guys,
BPCL has a very good setup right now. It seems to be forming a bearish bat with the second impulse wave in the formation.
This trade has an RR Ratio of 6.82. So that pretty much is a very good number to give in.
Sell in the red region and buy back lower at the 0.382 retracement.

CAIXABANK: Bad earnings may lead to drop until 1.80Bat pattern spotted in CABK + Elliot Waves finished at (E) may set continuation to 1.80€. Bankia won 64% less YoY.
But good earnings (or better than expected) may lead the stock price straight to 2.20-2.30.

#BTC bearish bat plus a TD 9 BINANCE:BTCUSDT
The funding is positive and it's TD 8 out of 9. Great time to hedge


Verizon Communications VZ bearish outlookEarnings were reported today and beat the estimates so keep that in mind. The technicals though look bearish IMO. We have hit a major trend line which so far hasn't been broken and looking at the size of the wick we hit a lot of selling pressure. Also we have created a Bearish Bat pattern which was completed when we touched the trend line. Would have been the perfect entry but still see plenty of downside potential. Also worth noting we have some bearish divergence on the 4hr RSI.
Playing the Bearish Bat my prices targets are:
Target 1 - $55.73
Target 2 - $55.17
Target 3 - $54.60
Good luck traders

POTENTIAL SHORT (BEARISH BAT APF) H1 TF)POTENTIAL SHORT (BEARISH BAT APF) H1 TF)
*THIS PATTERN WILL VALID ONLY UPON COMPLETION OF THE PATTERN
*W4C IS THE BEST WAY TO ENTER
Abbreviations / Keywords:
LTF - Lower Time Frame
HTF - Higher Time Frame
TF - Time Frame
TRS - Trend Reversal Strategy
CRT - Counter-Retail Technique / Break-out
APF - Advance Pattern Formation
W4C - Waiting for Confirmation
LLCC - Lower low, lower close
HHHC - Higher high, higher close
SL - Stop loss
TP - Target Profit
POR - Point of Ruin
RRR - Risk Reward Ratio
Risk Disclaimer: This is not a trade signal hence we'll not be held responsible for any losses that will occur in your account during trading. You and you alone are responsible for deciding if you are comfortable accepting the potential risk involved in trading. So trade at your own risk and do not invest money you cannot afford to lose

Bergerpaint - Color me REDBergerpaint formed bearish bat and will continue to fall ... Also has supply zone at PRZ... Concern is supply already tested 3 times ... RSI has strong resistance on trendline...Targets on chart...

GBPJPY - Type2 Bearish BatA type 2 bearish bat pattern has created a trend trading opportunity. Pending order has been set in, let's see how's the trade goes.

CAIXABANK: Approx. #Bearish #batpattern on its way & Q2 earningsThe bank's results are due on July 24th. JP Morgan and Wells Fargo saw sharp declines on profits (-51% and -71% respectively) yesterday and I expect Spanish banks will be unable to avoid them too. Besides, CABK has been the bank who's best performed in the short-term post-covid era, so we could expect bigger downward corrections than those in Santander or BBVA once their results come in. Barclays "saves" CABK and SAN's rating but still forecasts a -52% decline on profits for the sector although in my opinion, I expect -60% minimum.
From the technical point of view, an approximated bat pattern is being formed and its figure may be ended either today or tomorrow at level 2.10-2.12. Once it is completed, the bank's share price may drop towards 1.80 level (0.5 Fib level) or 0.382 Fib livel (1.878) in case earnings readings are better than expected.

EUR/USD goes down to the point 1.12500Hello traders. After the growth, the pair will correct to the level of 1.12500, then again a fast bull wave above the 1.15000
1.Pattern gives the way down
2.macd shows bearish
3.bearish divergence
4.Stochastic is oversold
Have a nice day and Profitable trading for all.
This is my personal opinion and NOT an instruction to act.
