SBI CARD - Time to take pauseSBI Card Formed Bat Pattern on the daily chart with a precise prz in the area of 740 . This Pattern possessed three levels in tight zone of 735 - 742.
The Bat is the most common and precise pattern and requires a smaller stop loss than other patterns.The 0.886 XA retracement is the most critical level in the Bearish Bat pattern.
I Always wait for the entire PRZ range to be tested to validate the completion of the pattern, though it delays the execution process, but the trade you take then won't test much of your patience.
Note : BC swing slightly exceeded the A Point , so its not a perfect Bat pattern, but i am considering it as a Bat pattern, because of the close alignment of various Fibonacci ratios in the prz area..So Slight adjustment/leeway is allowed in the real trading world.
Bearish Bat

#BearishBat #Australia 200 #Index #ShortWe have a bearish bat pattern near-completion on the 60 minute Australian 200 index.
Entry @pprox 6038.5
S.L. @pprox 6069.2
T.P. 1 @pprox 5984.4
T.P. 2 @pprox 5929.2

Spy - Bearish bat formationSPY Tight squeeze
Can go in either direction , the graph looks to me like it will go down soon, maybe a little up, but ALOT downward potential (in my opinion)
Notice the W shapes on the graph before it crash. (bearish bat)
i dont like the W too much... play SPY safely! except a surge of downward movement soon.
SPY is at a weird state where stocks have been breaking out as well stocks are undervauled.
When one stock consolidates another one breaks out , spy goes up nonstop. but this wont last forever!
When the main overvauled stocks sell off it will shock the whole market and people will get scared
Puts on spy @ 318+highs , Calls on spy when 300+low

Titan - Bearish BatTitan making bearish bat and price reversal zone in between 1015-1035... Targets on Chart

GBPNZD Harmonic PatternHello guys
Whats up ?
Everything is shown on chart
We have a harmonic ( bat ) pattern , it seems
Dont forget stop loss
Good Luck
Abtin


USDJPY-Weekly Market Analysis-Jul20,Wk2A bearish bat pattern on the 1-hourly chart, although it is higher than the daily resistance level I'm spotting at 107.87, it is still a great setup and this is why.
On the 1-hourly chart, the market can touch Point D, shows a bearish engulfing candle and close below 107.87 before the daily candle close.

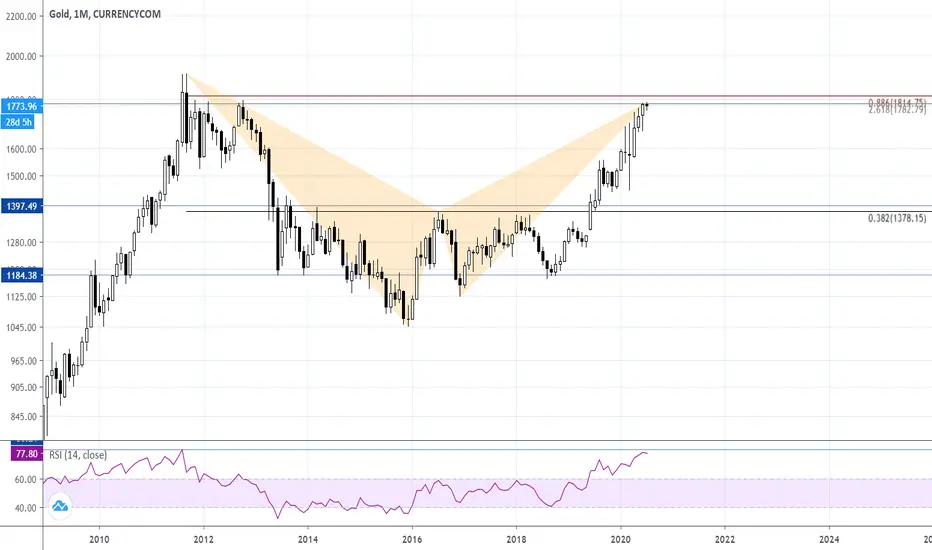
Time for Gold to take a PauseThere is a formation of Bearish Bat Pattern on Gold Monthly Chart.
Bat pattern Prz zone : 1785 - 1811
AUD/CAD Bearish Bat Pattern at Strong Resistance Level1. Bearish Bat Pattern.
2. Strong Resistance level.
3. Consolidating market.
Take profit 1: 38.2%
Take profit 2: 61.8%

EURUSD my viewAlthough the possibility of shorts being squeezed out here is very real, I cant ignore the patterns in front of me.
Long TF bearish bat and a shorter TF ABCD playing out. I think it's early enough in the ABCD to get some good RR.

USDINR #US #USD #UnitedStates #Indian #Rupee 60 minute #shortA bat pattern seem to be maturing on the last part of it's journey, from leg C to leg D.
Sell from 75.948 (approx) for a R/R of 2.08% on T.P 1.
Sell again from 75.948 (approx) for a R/R of 3.31% on T.P 2.
Thanks & good luck in all your trading.

BATBTC UPDATEIts Time for BAT Breakout Decisions . If Breakout Done With Volume then We can good move in BAT

Updates of GBP/USD: Beware of Manipulation!!!Hello guys, in this technical analysis I found up a another armonic figures a BAT, So, the target is reach at 1.618% of Fibonacci, now, we find up with bearish candlestick pattern and so, it's mean a possible manipulation of this zone, I use my secret Fiboancci called Shark Hunters, well, it's never get us this pattern when we do in the morning a possible buy zone, but it's have a invalid because this is a price consolidated a little, so, don't put any long position in there. Because if you use any indicator as MACD or RSI there show us a bearish divergence, but specially in MACD we see a weakness of the price, and it's a possible go back into the bearish channel.
Also, I add my previously technical analysis of this par!!!

AUDJPY Bearish Bat Pattern near completionBearish bat pattern maturing on the 30 minute AUDJPY chart.
R/R = 2.94%

AUDCHF Bearish Bat shortAUDCHF bearish bat short on the 15 minute chart with T.P. points.
1) R/R = 2.31%
2) R/R = 2.92%

GBPJPY - Bearish BatA Bearish Bat Pattern that has an ABCD Pattern converge at the same level, it will be a level that I expect a high volatility movement, it will be a good level to consider for a shorting opportunity.

Harmonic Bat + 5 wave impulse downOk, I just finished building this, now let me see if I can remember it well enough to explain it, lol. ;)
It starts with the harmonic bearish bat. Harmonics are about Fibonacci confluence and there are 4 fib rules to a bat.
1. B is 38% or 50% of XA. 50% is more reliable.
2. C is 38% of AB.
3. CD is the magical 88% of XA and/or 1.61 or 2.61 of AB.
So far, we have a bearish bat. There are 3 price targets. 38%, 50%, and 100% of AD, labeled in the purple box. Sometimes, profit can extend to 1.61% of AD.
Next, it also looks like we possibly have an elliot 5 wave impulse down, which so far fits tightly around the "D to profit" trend line. The 3rd wave down lands right in the sweet spot of two of the targets for the bat. I'll be taking some profits there. We also don't know if the FED and/or Congress will step in around this level. In March and April SPX was around 2400 - 2700, when money starting flowing back in from both sources. I'm fearful of a bounce in this area coinciding with more fed action and will likely take most profit here, and very carefully play wave 5 down. Small sample size, could be coincidence. I think the Fed is too calculating for coincidence though. However, they can't keep propping it up forever either.
Some other stuff:
- Today we retested twice and were rejected twice (so far) from the upper channel trend line we have been in for April and May of this rally.
- We weren't able to close the gap so island top reversal still in play.
- The island top occurred right at the back-test of the 2018 bubble line which we have so far aggressively been rejected from.
- We have the longer 11 year bull line just below at around 2700. This could be a bullish turnaround point if we bounce off of this line, if brrrrrr, etc. This could complete the Bat. To hit deeper targets, we need to slice through that line, maybe back-test (in the wave 4), and then head down further to 2475.
Me thinking out loud and possibly over analyzing (may be more confusing than helpful so feel free to skip):
- It's a little tricky because profit taking for the bat is above the 11 year line, and in order for the back-test to occur in wave 4, wave 3 needs to finish below the line, extending past the 38% and 50% profit zones but not far enough to reach the 100% zone. We know harmonics and waves aren't precise, just guide posts. Just keep this in mind. I'm happily open to any feedback, questions, etc.
- I suppose wave 3 could finish in the profit zone, and then wave 5 takes us through the 11 year line, but that doesn't leave a lot of room for a back-back test. Maybe we test it after completing wave 5.
- Lastly, because I started my A for the bat higher than March lows, I don't know if this means the larger A of ABC is at the bat A or at the lows, hence the two As and two Cs. (March lows are a 38% extension of my X(bat)A).
Thank you for reading. This is not trading advice, just the working model I am following at this point. Happy trading and good luck!


Bearish Bat Harmonic, SPX Short The Bat gives us much shallower targets than the Gartley I posted earlier but may be more precise. Maybe they will both play out and we'll reach March lows (and then some) after all. But if we're trading the Bat (hoping for the Gartley), the three targets are 38%, 50%, and 100% of AD, starting around June 22nd through to July 15th.
The difference between the Gartley or the Bat pattern for this move is where "A" is placed. On this Bat, placing "A" at 2478, gives us all of the correct fib rules (give or take 1%) for each leg, with the March low being an extension of price point "A" before reversing.
I posted a gartley/bat chart earlier, but I wasn't satisfied with point "C" not following the correct Fibonacci rules with "C" and "D". Finding the correct points can be an art as many say, but I'd feel more comfortable trading it if the fibs were only a couple percentage points off, rather than a large chunk.
This is not trading advice. Good luck and happy trading.


S&P500 D: Bearish BATBearish BAT in play on the daily time frame. Right now price found the support at Kijun.
If this level break Bullish BAT on H4 will be confirmed as below.
My entries on the chart. I will be adding more if 3k breaks and confirm the H4 BAT and ABCD.

AUDUSD - Bearish BatIf you have been following me for some time, you will know that I'm very bearish on AUDUSD on a longer-term(3-years) perspective.
This Bearish Bat Pattern is at a perfect shorting opportunity on the daily chart. That being said, confirmation of the candlestick it's important.
