USDSEK Potential Bearish StructureI'm not going to explain it because you can see that it's obvious(Bearish Bat and Butterfly). PS, I'm not trading this, just sharing the idea.
Bearish Bat

USD/CHF Ways Downward!FX:USDCHF
USD/CHF is on it's maneuver .
Bearish Bat formed in past days , the price retest it Two times by retracing from it.
Now we are waiting for it to break the level then we will go for short.
Please follow us for new hot exciting ideas!!
* This is not an investment advice just for education,
* Our work is to give you the best-est possibilities and probabilities about markets,
Thank you.

Trade Ideas Educator: NZDUSD BatWithin the bearish bat pattern on the daily chart(right), it falls into the double buy zone for trend trader to plan their trade. On the 4-hourly chart(left), it doesn't have a very clear signal for entry to the upside yet but it is surely a waiting game for this and in most cases, we will know the outcome by this Wednesday.

Trade Ideas Educator: GBPJPY SharkBoth charts are on a trend trading setup in their own rights. Bearish Bat Pattern still stands within the sell zone.
Bullish Shark Pattern on a bullish shark on the final entry opportunity shall see how the setup unfold.

Trade Ideas Educator: GBPAUD BatOn the daily chart(right) it has a AB=CD movement, then market retrace to the sell zone.
On the left, within the sell zone, forms the bearish bat patter(4-hourly) for a trend trading opportunity.

Trade Ideas Position: GBPAUD BatBearish Bat setup for a trend trading opportunity. Selling opportunity within the sell zone.

||EUR/GBP SELL h2 HCH||||EUR/GBP SELL h2 H&S||---Bat in Daily tf + 61.8% fibo + key level at 0.90000 + RSI divergence.

Trade Ideas Educator: NZDUSD BuyZoneA buy zone form within a bullish trend trading opportunity. On a higher timeframe, daily chart(right) it does show a bearish bat setup as a counter-trend trade and also a buy zone as a perfect setup.
What's your trade plan on this?


Trade Ideas Position: AUDUSD BatBearish Bat setup qualified as a counter-trend setup. The reward:risk isn't the best for this setup, will this be the trade you will still be taking?
Comment down below how you are going to engage this trade?

AUD/NZD Bearish BatPotentialy Bearish Bat Harminics Pattern.
I will wait to Short D.
Better Risk Reward Ratio.

Trade Ideas Analysis: EURJPY >A sideways consolidation gave an aggressive trading opportunity, as the trendline sits firmly I will wait for a buying opportunity to engage the trade and I'll decide at 1700hr(+8GMT)

LONG Trade Ideas Educator: NZDJPYA sideways consolidation slowly creeps in into this chart. Just as you are going to say that Both support and resistance of the leg that broken it is well supported or we resisted.

Trade Ideas Educator: EURJPY ConsolidationA sideways consolidation slowly creeps in into this chart. Just as you are going to say that Both support and resistance of the leg that broken it is well supported or well resisted, it does pose a potential aggressive long opportunity.
Should the market break upwards a bearish bat setup and should the market break downwards a bullish butterfly awaits.

Trade Ideas Educator: AUDCAD BatYou can see how nicely the 4-hourly chart(right) close within the sell zone although the 1-hourly chart(left) said otherwise.
On the 1-hourly chart, the bat pattern forms at 0.9192 for a shorting opportunity should the market extend further.

USDJPY-Weekly Market Analysis-Jul19,Wk3Given a choice, I will not gunner for a head and shoulders bottom, a bearish bat with a bullish shark at the same time.
It is what it is as all these 3 opportunities are valid. Let just look at the head and shoulders bottom setup, a great retracement that gives me the opportunity to engage the trade as a counter-trend setup.
Whether to stretch the target to the bearish bat shorting opportunity is another story but its possible. Not forgetting at this moment there is an RSI divergence. Does this setup give you a scare, I don't. 1) Trade what you see
2) Follow your trade plan

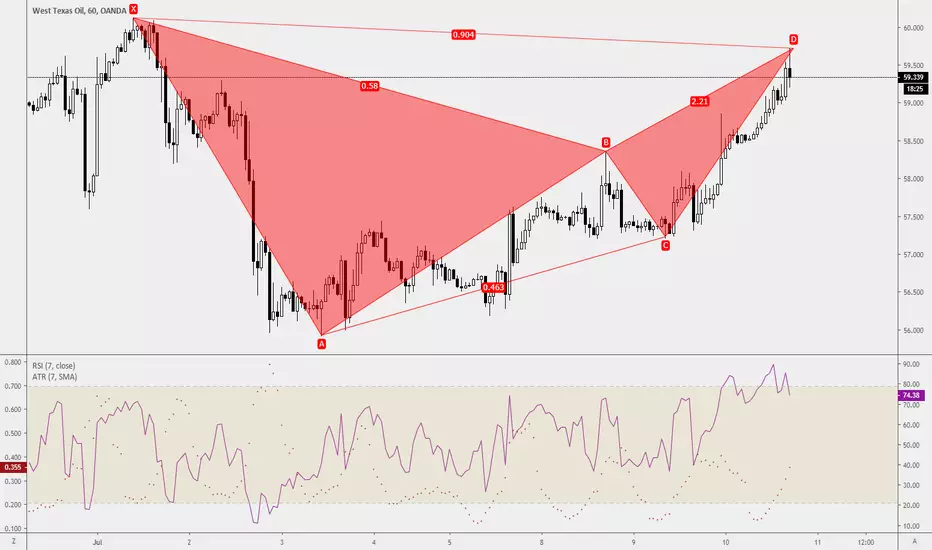
Trade Ideas Position: USOIL BatShorted this trade as a counter-trend trade but did an extension on the second target.
BTC/USD - Bearish Bat ScenarioBearish Bat Pattern Rules:
AB can retrace between 38.2 – 50% of XA
CD can retrace up to 88.6% of XA
CD can retrace up to 1.618 – 2.618% extension of AB

Potential Bearish BatPotential bearish bat forming. Extension levels are converging nicely for a tight range at 88.6 of XA. Price action observation at this level for a potential short.

Trade Ideas Educator: NZDJPYWell, this is 1 of the most interesting setup having the 4-hourly trend setup entirely different from the daily chart and 1-hourly chart.
So what is this about? Well, based on my experience, is more likely for the Top Chart(4-hourly chart) to trigger than the other. Hence, I'm waiting for a buying opportunity as a counter-trend trading move at 70.75
However, if the market did rise to 72.83 after the market gave the signal to engage a short, I will not hesitate to engage it.

Trade Ideas Educator : NZDUSDBottom Left shows that on the weekly chart, NZDUSD is having an emerging bearish bat pattern that I'm waiting for a shorting opportunity but of course that won't be ahead on the daily chart on the bottom left that too have a bearish bat setup.
On the 4-hourly chart will be the most immediate opportunity, however, the market has to retrace by Tuesday, 9 July 2019 to make it possible. The ideal sell zone is within the red box.
What're your thoughts on this? Comment down below.

USDCHF Short Selling IntradayUSDCHF 4hr Chart formed a bearish bat pattern
Short selling Intraday ( #1tg )
All details on the chart
Good Luck!!

bearish bat in USD/JPY 1Hits a good setup for bearish bat pattern and overbought stochastic in 1h chart. also in 4H chart 200 SMA is down trend. all things are good for a short position.
but be careful about today USD news. ( ISM Manufacturing PMI )
