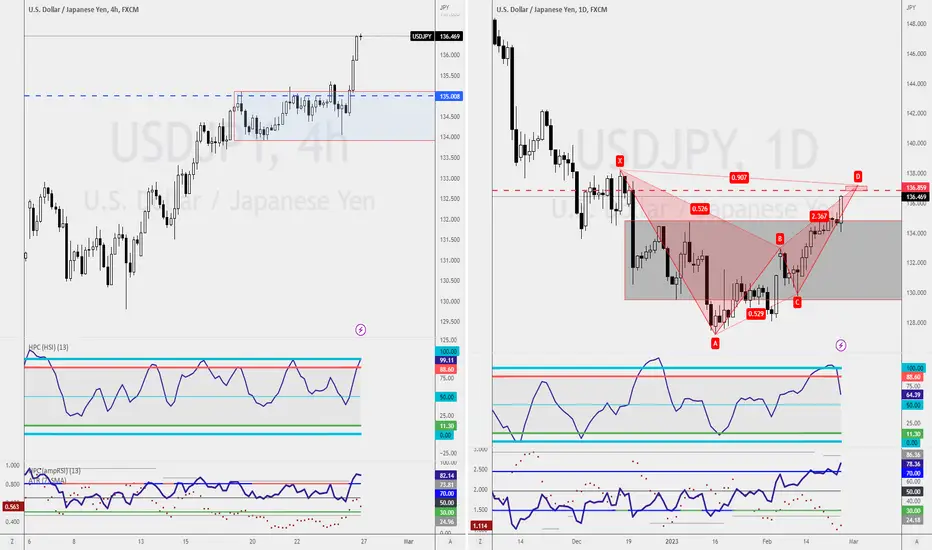
USDJPY: Bearish Bat Nearing Top of Rising Wedge.USDJPY is trading at the PCZ of a Bigger Daily Bearish Bat and a Small 15 minute Bearish Bat and it is trading near the supply line of a Daily Rising Wedge; If the patterns hold out we will see USDJPY drop below the Bearish Dragon Trendline and begin a significant move down from here.
Bearish Bat

Unveiling the GemsSideway patterns, often labeled as losers or deemed non-tradable periods by some, invite differing opinions and perceptions. It ultimately rests upon the individual trader to discern their potential. As for me, I perceive them as a treasure trove of trading opportunities waiting to be explored. Why, you may ask? It's quite simple - all I need to do is sell at the high, known as resistance, or buy at the low, known as support.
However, before plunging into these trades, I exercise caution and adhere to a meticulous approach. My aim is to ensure that my final target yields a profit factor of at least 2, and that a minimum profit potential of 50 pips awaits me before I engage in any trade.
On the right, a fascinating Bearish Bat Pattern is currently unfolding, tantalizingly close to completion at 0.6361. Meanwhile, on the left, the support and resistance trade strategy beckons with its own allure.
Now, the question arises: Which of these enticing trading setups resonates with you? Join me as we explore the path less traveled and unlock the potential hidden within these captivating patterns.

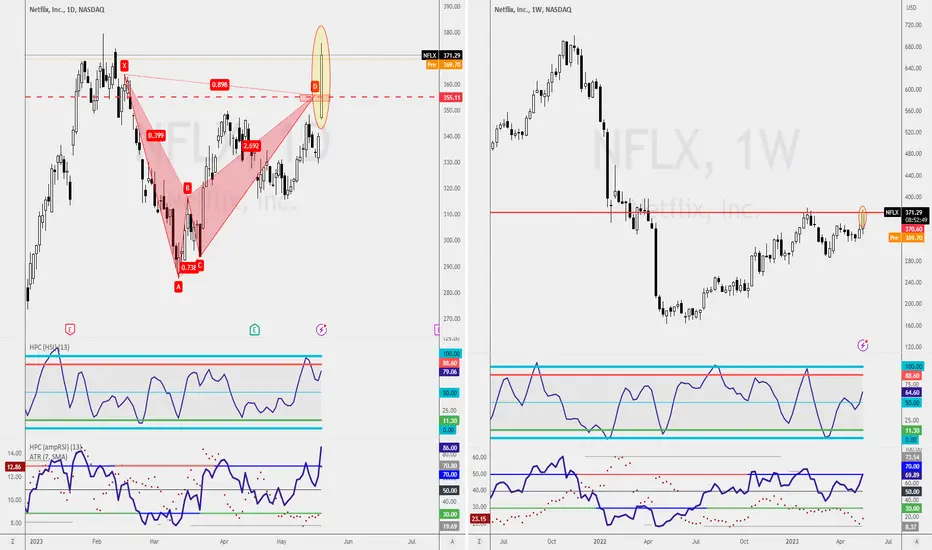
Netflix's Shorting Potential Slipped Away by a Mere Two DaysMissed the Mark: Netflix's Late Entry Foils My Shorting Plan, and Now It's Breaking Bullish Boundaries!
Oh, the frustrations of timing! Just two days too late, Netflix seems to be defying my expectations. It's now poised for a structural breakout, potentially closing above the X point of my carefully identified Bearish Bat Pattern.
While this turn of events may be advantageous for Netflix, discouraging more traders from shorting, it's a letdown for me after patiently awaiting this setup for weeks.
But hey, that's the nature of trading. Time to swipe left on this missed opportunity and patiently await the next promising setup.
That said, the weekly resistance level holds(right).
It's NO SECRET, I'm shorting AdidasIt's no secret that I've been looking to short Adidas for weeks before the Bearish Bat Pattern show up.
As a trader, I love to wait for the precise price with candlesticks confirmation before engaging my trade; hence I miss the first opportunity.
And that's ok!
In trading, I have this philosophy that is better to miss a trade than to engage in a trade at a price of disadvantage.
So here I am, trading for the past 18 years.
At this moment, I'm waiting for the Bearish Shark Pattern to form up on the 8 range bar chart to give me a second chance entry to get on this ride.

My Bullish Bias RemainsUSDJPY Shorting Opportunity Looming, But My Bullish Bias Remains Strong
In the midst of a Type 2 Bearish Bat Pattern on the daily chart and a Bearish Shark Pattern on the 1-hourly chart, traders may be eyeing a shorting opportunity for the USDJPY. However, my bullish bias on this currency pair remains steadfast.
Rather than jumping on the bearish bandwagon, I am patiently waiting for a prime buying opportunity on the USDJPY. I'm closely monitoring a Bullish 5-0 pattern that could potentially complete at 134.71, presenting an ideal entry point for a long position. Stay tuned for further updates on this developing trade opportunity.

Nordex's YoY losses up 133% and Debt/Equity ratio up 54%FUNDAMENTAL ANALYSIS
Current liabilities increased 47% up to €3.4bn in 2022 from €2.3bn in 2021. Non-current liabilities decreased 37%.
Debt to Equity ratio (2022) = 4.42x
Debt to Equity ratio (2021) = 2.87x
Losses YoY increased 133% to €522 million. EBITDA turned negative in 2022 to -€244 million from €52,672 million in 2021.
Almost all Guidance provided in March 2022 was exceeded downwards except for Sales Guidance.
Positive side: Sales increased 4.58%.
TECHNICAL ANALYSIS
Since April 6, the company has entered into a downward trend that in Oct 2022 attempted to turn around. However, the banking crisis and inflation fears persist in a way that Nordex's stock performance graph experienced the appearance of a Bearish Bat pattern whose prophecy together with its recently issued FY 2022 results could materialise in the following days and weeks to come.

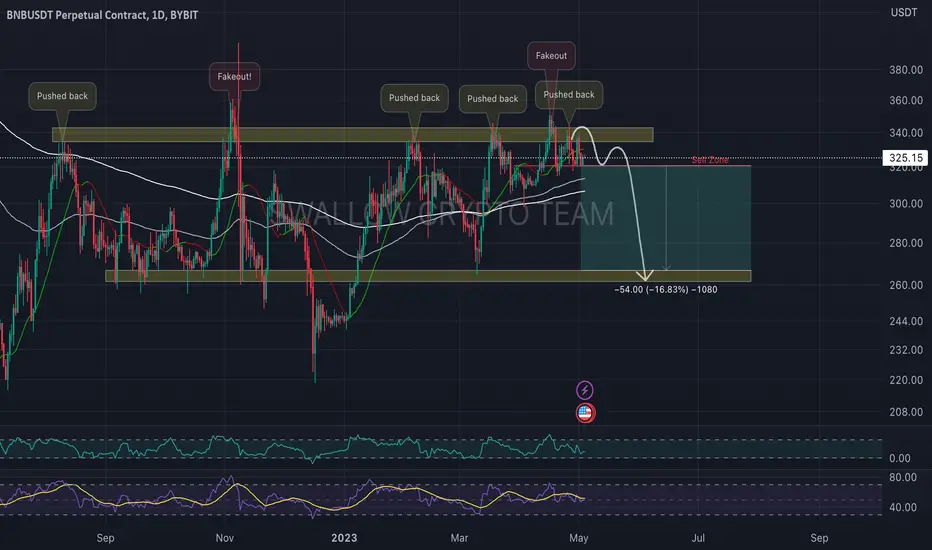
BNB/USDT had another rejectionHey guys 👋
Let's get back to BNB here where we see how price had another pullback from upper resistance zone and now we are on the edge of a cliff just waiting for a free fall. So let's see how we will end up here.
If you like ideas provided by our team you can show us your support by liking and commenting.
Yours Sincerely,
Swallow Team 🔱
Disclamer:
We are not financial advisors. The content that we share on this website are for educational purposes and are our own personal opinions.
Possible Short Plan for NEAROKX:NEARUSDT
The completenes of a Bearish BAT Setup is over the line but we can see side slip with a bearish engulfing.
If it is complete as we predicted we will be ready to short it.
Alarm set.
Good Luck Everyone.

TWITTER Bearish Bat SETUP 🦇Hi Traders, Investors and Speculators of the Charts 📈📉
Ev here. Been trading crypto since 2017 and later got into stocks. I have 3 board exams on financial markets and studied economics from a top tier university for a year.
The recent logo change following Elon Musk 's acquisition of Twitter has definitely affected the price of both Twitter and Dogecoin. But the rumor, sell the news and so it seems Twitter is taking a dive after a log period of upward price action. The bearish harmonic bat pattern short setup is discussed in detail in the video. Note that the prices are NOT USD, since Twitter is now a privately owned company and was removed from the NYSE late last year.
Here's a more in-depth educational idea on bullish and bearish bat / harmonic bat pattern / cypher patterns :
In another related idea concerning the logo change from the blue Twitter bird to the DOGE meme pup:
_______________________
📢 Show us some LOVE 🧡 Follow for daily updates and trade ideas on Crypto , Stocks , Forex and Commodities 💎
We thank you for your support !
CryptoCheck

Probably the Ultimate Combo Trade, yetA Bearish Fib-3 Bat is here giving us a ticket to get involved with the big boys. With a stop loss of only 25pips for this bad boy, it allows me to stretch the target towards the hourly and the daily chart target is just amazing.

DOLLAR CRASH!? NOPE! NOT NOW!!If you are on the Media, you would have heard that the DOLLAR is CRASHING, countries are ANTI-US DOLLAR, etc, etc...
I don't see any crashes happening on the chart. It is important for independent traders like ourselves, not to get swayed by the news headline; see it for yourself.
What I'm seeing right now, saddens me more than the crashes; the market is going into the consolidation phase.
How do I know that?
A series of Bat Patterns, that's it. The market reflects on what market participants felt.
If you are looking for shorting opportunity, you are in luck.
On Daily Chart(left), Bearish Bat Patterns completing at 136.96 and on the 1-hourly Chart, we have the Bearish Crab Pattern completing at 132.54 and Bearish Bat Pattern completing at 132.87.

GOLD H1Hello traders, GOLD is setting up for a downside move watch GOLD according to your own trading system or strategy and look for a short position trade setup opportunity.
I am currently watching price to hold around mentioned area and looking price movement for a short position setup, if price break the mentioned high then this setup will be invalidate.
This is just analysis, not the exact trade or any kind of signal that proven with wining or losing % so be sure trade with your own according strategy do not depend on my analysis.
I wish you good luck in trading.

I want an Upsize pleaseAn Upsize Trade is the name of 1 of my trade management.
On the 4-hourly chart(left) is a complete ABCD pattern. I'm waiting for a retest at 158.98 for a buying opportunity.
When the retest happens, I'll be stretching my final target to the Bearish Bat and Bearish ABCD Pattern which completes at 168.11.
This is a high-risk approach and it could harm your account if you do not know how to execute it the right way.

A 533pips of Profit missedA 533pips missed if you had not followed the analysis I've posted since March 6 (related link within this TradingView Post). It has yet to reach its final target.
On a longer-term perspective, the USDJPY is on a Bullish Trend and traders looking to engage the trade to buy can wait for a buying opportunity on the 4-hourly chart.
Some of the ways include a Double Bottom to engage the trade.

An Immediate shorting opportunityA Bearish Bat Pattern on a counter-trend trading setup allows traders to hop in and catch some relief from the market.
This could be an amazing trade for trade management matters.

USDJPY: Bearish Continuation TradeUSDJPY Reversed on the MACRO from a Bearish Butterfly PCZ on the Monthly and has since gone down about 15% as seen here:
But recently it's had a bit of a rally as the DXY showed a bullish pattern that it indeed bounced from here:
However it would seem that the USDJPY is showing quite a bit of weakness with the MACD confirming Hidden Bearish Divergence and Crossing Bearishly after price was rejected from the 200 Day SMA and the PCZ of a more Local Bearish Bat and could be a sign that the rally in the DXY will be coming to an early close; but more specifically it could be showing that the JPY will start to show Dominance in the FX Markets again and that this Local Bearish Bat could be what sets off the Bullish Continuation of the JPY Dominance.

GBPNZD - Bat Pattern Forming SOON!Bat patterns on GBPNZD are very profitable on the 4H timeframe.
- Entry: 1.96189
- Stop Loss: 1.97407
- TP1: 1.94499
- TP2: 1.93456
I have set a limit order at my entry price. If price moves against me I will trail my take profit levels in accordance with the 38.2 and 61.8 retracement levels from the low of the pattern to the current price level.
If the pattern is invalidated before hitting my entry limit order, I will delete the order.

The Short Plan will be helped by Order Block (ADAUSDT)OKX:ADAUSDT
0.36 level seems very liquid for ADAUSDT
Last two Stop Hunt under this level and bull trap also support the importance of 0.36 level.
If the price moves on the direction of blue arrow we will be prepared to arrange a short position.
Opening position on the direction of blue arrow is also another plan but we need more bullish price action signals.
Good Luck Everyone!

A retest could save your some moneyIf you have managed to short the USDJPY trade on the Bearish Bat Pattern, congratulation is on the way. If you have not engaged the trade, perhaps you can wait for the market to retest 136.95 on the 1-hourly chart to engage the Bearish Shark Pattern could be the next best thing that could happen to you.
All you need to do is to wait and see if the opportunity presents itself.

You have not missed out on EURUSDIf you thought that by following the rules of the Harmonic Patterns caused you to miss out on profits of the 4-hourly chart Gartley Pattern, here is a second chance.
The Bearish Bat Pattern on the 1-hourly chart completes at the same region as the Bearish Gartley Pattern. This is amazing because should the Bat Pattern complete it offers a trade with a lower-risk trading setup.

A mistake that most traders might makeOn the right is the daily chart, and on the left is the 4-hourly chart. It is a common mistake for traders that have been trading for 3-5 years and believe that the higher timeframe always supersedes the lower timeframe.
Similar to corporate hierarchy, our superior is not always correct.
There are a couple of factors that determine that. One of it depends on the overall market bias on the currency.
My Bias on the US Dollar pairs remains bullish; hence, I'm not motivated to short USDJPY aggressively when the market has a Bearish Bat Pattern formation. I would require to see a further market confirmation, like a Double Top form at completion, giving me an RSI Divergence before shorting the trade.
On the other hand, I'm waiting to long the USDJPY at 135.00 on the 4-hourly chart, which happens to be the Key Support Level.
Harmonic Bat Pattern for traders can apply on any time frameThe Bat is defined by the .886 retracement of move XA as Potential Reversal Zone. The Bat pattern has the following qualities:
Move AB should be the .382 or .500 retracement of move XA.
Move BC can be either .382 or .886 retracement of move AB.
If the retracement of move BC is .382 of move AB, then CD should be 1.618 extension of move BC. Consequently, if move BC is .886 of move AB, then CD should be 2.618 extension of move BC.
CD should be .886 retracement of move XA.

An upsize trade coming upA Potential Bearish Bat Pattern is looking to complete at 0.9314. This allows me to trigger my upsize trades and gives me an opportunity to stretch my final target to the completion of the Bullish Shark Pattern on the daily chart.
In order for that to happen, a series of confirmation need to be in place, 1 of which require a violation of the Buy Zone/ Demand Zone(blue box).
