Don't Count Out Apple 250AAPL Looks to be very possibly fitting well within the given ranges of a Bearish Butterfly harmonic pattern. See attached image for fib levels. The "B" point is very slightly above the required .786 level, with within range to legally call this butterfly pattern in my opinion. While I am not currently trading this, just an interesting contrarian view in the face of so much bearishness in the market right now. My previous post (linked) showed a Dark Cloud Cover pattern that developed Friday, and was confirmed by the large move down today. Would not be surprising to me at all to see a green day to about 208 area tomorrow to stay within the wedge pattern AAPL has built at the moment. To me there are just far better places than this to get your money in if you want to be on the short end right now. In any event, happy hunting and GLTA!! tradingstrategyguides.com
Bearish Butterfly


$BTC/$USD @Coinbase Descending Triangle or Bearish Butterfly!?Good morning ladies and gents. I am currently in favor of the descending triangle over the symmetrical triangle simply because each swing low tests a support zone compared to your swing highs which are just making drastic lower lows without an actual resistance zone. That being said, let's look at this in a bullish perspective if the breakout happened to the upside! 1. You are currently at a perfect Neutral on the Daily RSI. 2. You have Bullish Convergence (Higher Low on Price actions and Higher Low on Oscillators). If we did break out to the upside, the Descending Triangle pattern target takes us to the PCZ of the Bearish Butterfly above $16k. I have a zone between the 1.272 and 1.618 golden mean ratio where major price reversal could take place. These are opportunities of a short with coinciding variable of course. Now, with the bearish perspective, you are currently overbought on the one hour time frame and almost four hour time frame. You also face geometrical resistance alongside getting above our previous high's. Breaking our previous highs and geometrical resistance could be a good sign for further price action to the upside, but that being said a potential shorting opportunity is illuming with the Bearish Butterfly if we were to hit the PCZ in said time.


HIGHLY Speculative Bearish Butterfly on the WeeklyThis is the first time you will ever see me giving speculation on the market, but this is a very speculative Bearish Butterfly in development on the Weekly Time Frame. First we'd need confirmation of the potential Descending triangle. But how I came up with these targets and patterns is using the same math and patterns that have developed in the 2017 bull run and the current one. But a reoccurring phase or (Shortcut to the Market Cycle) in variables would be in this order, A) Parabolic, B) Blow Off Double Top, C) Descending Triangle, D) Capitulation and then repeat! I worked really hard on this and it's just an extremely speculative idea for now. But how badass would it be if that played out. A Bearish Butterfly on the weekly time scale lol


KSCL - 4 Hourly ChartKSCL - Completed Bearish Butterfly Pattern. Price reversed from the PRZ and now waiting for the 1st Target.


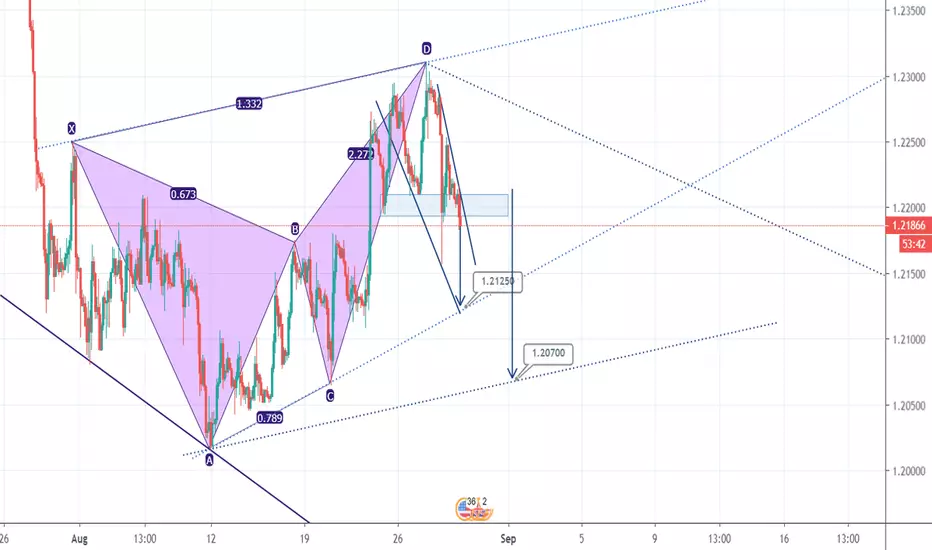
USDCAD bearish moodTP 1.3145
On the daily timeframe on the spike of the right wing of the butterfly there is a candlestick pattern “shooting star”.
I hope bearish butterfly pattern has completed its formation.
To be sure of reversal, you can wait for the next candlestick to appear.


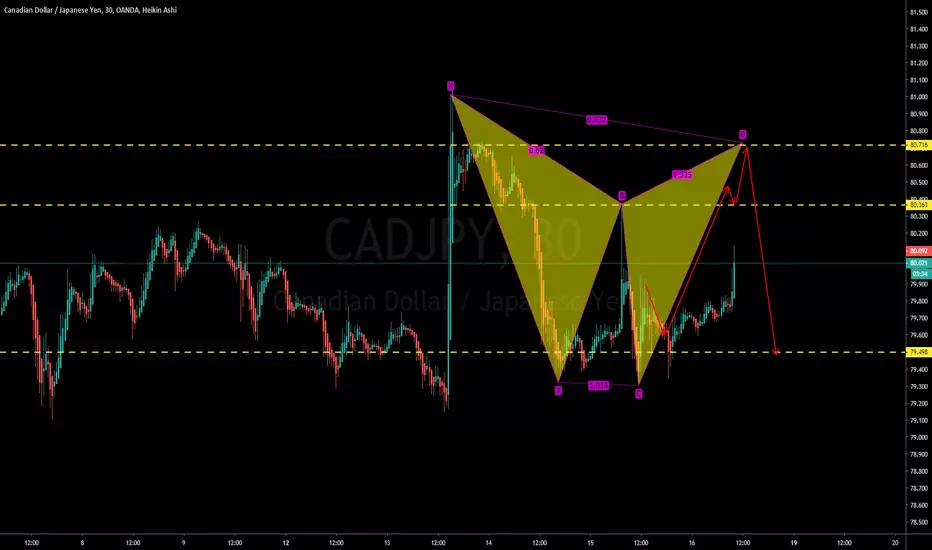
Trade Ideas Educator: CADJPY ButterflyA Bearish Butterfly set in on the 4-hourly chart(right) but by having that it will break the prefered sell zone. For my plans for selling opportunity will be the classic reversal setup I'm waiting for MC+confirmation within the sell zone.
On the 1-hourly chart seems like a bull flag is likely to form, I will wait for a retest into the buy zone for a buying opportunity, and if you head to the M15 chart you will see a bullish bat setup.

NEO/BTC, Long+Short, Bearish butterfly on daily TFWe have a bearish butterfly on the daily TF for the pair NEO/BTC. At the same time we have an ascending triangle which breakout could reach D to go down to pursue the downtrend initiated at the begin of April.
The RSI was also very bearish, it crossed the 50 line now but could dive again if the pattern is confirmed.
For the long part: from the breakout until we reach D.
For the short part:
Buy-in: 1999 in the PRZ of the pattern and also resistance
TP1: 1701 which is the last major support
Other TPs on the small supports initiated by the triangle and the fibonacci supports. If the ATL breaks, the TPs are located on the extended fibonacci ratios and pivot points but don't be too greddy as usual.
SL: 2110 just above the 2.414 fibo line which also corresponds to a resistance

BNBBTC about to dump ? Short opportunityWe have bearish signals on the BNB/BTC on the daily TF.
On the harmonic pattern side we have a Bearish Butterfly while on the technical indicators side we can see also bearish divergences on the RSI and the MACD.
The BNB can start to retrace a bit which can be a good opportunity for a short.
Buy-in: 52150
TP1: 44770
TP2: 39000
TP3: 35700
SL: 57700

BEARISH BUTTERFLY ON EURGBPOn EURGBP 4hr chart a bearish butterfly has formed. The D leg has completed forming, Look for bearish opportunities before taking the Trade. Use proper money management. Cheers

EURGBP H4 Chart Harmonic Overview: Potential Bearish Butterfly Bearish Butterfly as described on the chart.
We will wait for a reversal pin bar to enter the trade.
I will publish the details and send the entry notification.

Gold : The Iceberg III - Round And Round We GoFX:XAUUSD Weekly Analysis - Money Is Coming to Me.
Potential Bullish Shark Pattern 1.13
Potential Bearish Butterfly Advanced Pattern AC 1.272
Support and Resistance Levels
Moving Averages
Fibonacci Retracement Levels
This is an adjustment from the previous Weekly analysis.
The Money Journey - Hope for the best and prepare for the worst.
Press the Like's button (Min +10) to get an update analysis on the spot and let's Reach Your Dreams by Following My Journey's.
