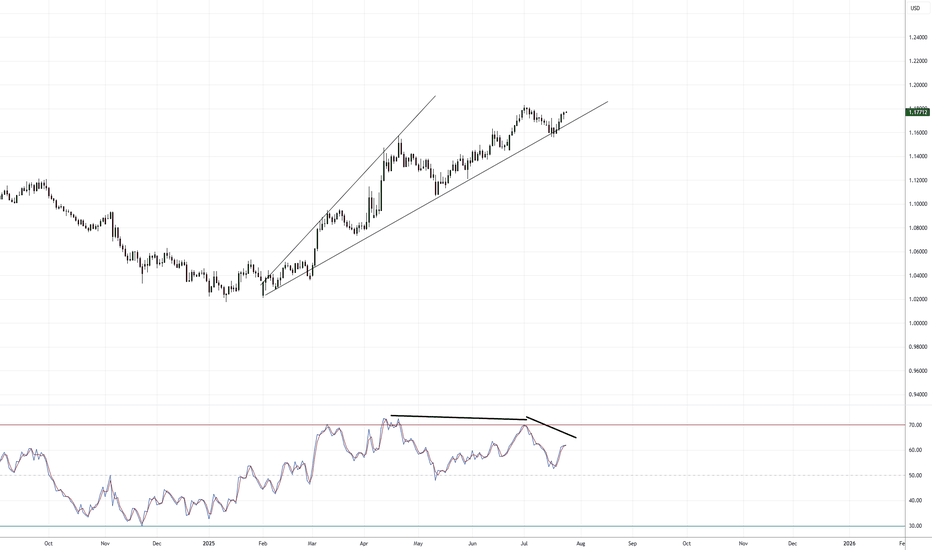
EUR/USD: The Last Bear Standing...As indicated on my previous EUR/USD idea ( that's still currently open ), I remain short EUR/USD given the technical aspect of things are still valid.
Divergences are still in play along with a rising broadening pattern and the fact that we're trading at the yearly R3 level ( which is rare ).
I suspect we will have some volatility with the ECB press conference tomorrow, so that should get things moving hopefully in the bearish direction. If we begin trading aggressively above 1.1800+, that will invalidate the short idea overall.
If we roll over, I'm still looking for 1.13000 - 1.12000 as the target range for Q3 going into Q4.
We'll see how this all develops.
As always, Good Luck & Trade Safe!
Bearishchartpattern
EURUSD SHORT IDEAWe are in a downtrend and we have a support holding has a strong resistance right now,i will be expecting price to continue downside when the market opens. The last two touches are forming a double top at the resistance so i will be looking for price to continue to push down, Also there is a retest of a bearish chart pattern.
How reliable is head and shoulders pattern, Nifty50 1DThe head and shoulders chart depicts a bullish-to-bearish trend reversal and signals that an upward trend is nearing its end. The pattern appears on all time frames and can, therefore, be used by all types of traders and investors.
The head and shoulders patterns are statistically the most accurate of the price action patterns, reaching their projected target almost 85% of the time. The regular head and shoulders pattern is defined by two swing highs (the shoulders) with a higher high (the head) between them.
Publishing chart what caught by my naked eyes...!
Rest all on you...
Regards
BTC/USD - Heading to $21,000As we watch the price for BTC develop from it's recent lows, we haven't seen much bullish action and it seems as if bears just have complete control at the moment. I was super bullish on this pair but as we move forward, there are just more and more signs that BTC will soon be making a new bottom.
With the little amount of buying pressure I'm currently seeing price struggle more and more after the recent closure on the 4 hour.
(which I believe you will be able to see if you were to "make this chart yours", you'll be able to see a further breakdown on other indications I found that helps support this current trade idea.)
- Two Failed Inverse Head and Shoulders
- Current (Completion) of Head and Shoulders
All in all, it's really not looking good for any bullish traders that are still trying to bet against the current trend and feel bad for all those still holding.
I do believe we will see price come back and retest its structure that lines up with the 23% fib level on the 4 Hour Time Frame, and again on the daily time frame in an attempt to capture more bulls before the next leg down because that's the pattern we've been seeing this whole time.
I did have a couple of other things like wave analysis and a few other points but I want to get this thing out before the move happens and it's already been over an hour since I started. Lol.
Trade Smart and Trade Safe
Has Top Glove bottomed? RM10 incoming? RM13 incoming?Awhile ago, we have started to see a M shape starting to form on Top Glove. In textbook, we call it the double top meaning price will reverse back to original level soon.
This link will help you to study about double top, www.finvids.com
But we have no confirmation yet until today 5pm we saw TG closed below RM6.11 key support level also called as the neckline. This therefore now serves as the first confirmation sign TG price will likely soon go lower than RM6. Second confirmation is to see TG breaking RM6 before we can confirm it will be heading to RM5.
2 more things to support this analysis:
- All key moving averages have been broken. Look at all the colourful lines, TG is trading below all the main colorful lines now.
- There has been a formation of 3 black crows on pass 3 days trading pattern. (Lower lows and lower highs were formed, this indicates further drops in days and weeks ahead.)
To study about 3 black crows, please visit the link below:
traderlaunch.com
With all of these, I think the hope of seeing RM10 and RM 13 per TG will still be far away. The likelihood of incoming RM 4.50 to RM 5.50 per TG has higher chance now.
Trade carefully everyone, cutting loss is also a profit taking strategy if you are not comfortable to see this falling knife upon your hard earned savings! More updates ahead soon!
Wishing you all a happy new year 2021!
MATICBTC broke bearish flag 🦐MATICBTC broke bearish flag, and now the price is testing daily support, if the price will break the support, and turns into new resistance, According to Plancton's strategy (check our Academy), we can set a nice order
–––––
Follow the Shrimp 🦐
Keep in mind.
🟣 Purple structure -> Monthly structure.
🔴 Red structure -> Weekly structure.
🔵 Blue structure -> Daily structure.
🟡 Yellow structure -> 4h structure.
⚫️ Black structure -> <4h structure.
Here is the Plancton0618 technical analysis, please comment below if you have any question.
The ENTRY in the market will be taken only if the condition of the Plancton0618 strategy will trigger.


