EURUSD - Bearish Crab Pattern RetestA bearish crab pattern has completed and reacted slightly, it is retesting PRZ again.
We see a bearish divergence on RSI, a good bearish sign.
Looking to short on Monday.
R:R at 1.3 (TP1) and 2.2 (TP2). Good luck.
Bearish Crab

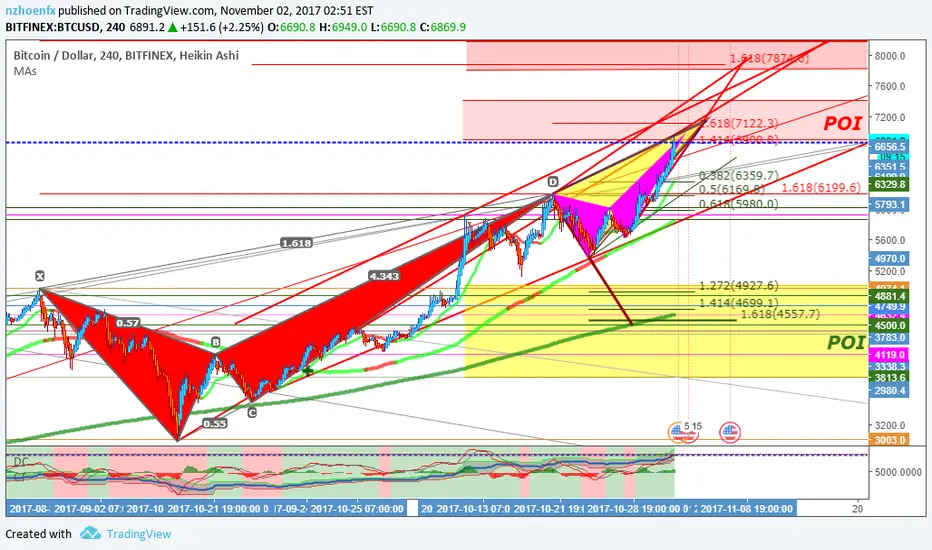
Bitcoins Harmonic SymphonyAs you can see, since mid January we have had multiple harmonic patterns play out with extreme accuracy.
Starting with the Bearish Gartley that sent us from 12k all the way down to our low of 6k.
This of which completed a beautiful Bullish Butterfly that has sent us soaring to where we are now.
After an 80% increase from the bottom, we now have multiple Bearish Gartley patterns forming. Most of which are showing completion within the same zone.
The chart above shows many possibilities. We have a Bearish Bat , Bearish Butterfly and even TWO Bearish Crabs .
Three of which are showing heavy resistance from 10.8 through 11.1k. Meaning this could be an excellent short opportunity.
If Bitcoin manages to break past the 2.618 fib level, the next major resistance would be the downward trendline. Then the completion of the Bearish Crab extension following.
If these patterns complete themselves, my first major target is $9.1k
Possibility giving us all another great buying opportunity!
I wish you all the best of luck!

USDJPY M15 bearish crab pattern - SHORT into the FED decision?USDJPY M15 bearish crab pattern - SHORT into the FED decision?

EURUSD - Crab Pattern Completed on H1 ChartBearish crab pattern has completed with RSI at overbought level.
I will not be awake when the market opens tomorrow.
For those who are awake, try to enter only when RSI drops back to 70 and below.
R:R at 1.4 (TP1) and 2.4 (TP2).
Good luck.

GBPAUD-H4-Bearish crab at resistanceWe have another crab that gives good R/R ratio.
I expect some reaction near a strong resistance visible on D1 chart:
On H4 chart a bearish crab is near completion, giving a good opportunity to short.
Best regards.

EURCHF - Potential Crab Pattern CompletionA potential bearish crab pattern is about to complete.
R:R at 1.6. Aim for 38.2% retracement.
Good luck.

BTCUSD 11/02BTCUSD Monthly Update - November
POI 2 Zone Current
POI 3 Zone added
Previous analysis
The Hunt for Red October II - Valid
========================================================================================================
Caution, I only trade on a moderate trend basis on H4 D1 and sometimes W1 .. I am not chasing any small movement and I also dont easily change my point of view by giving a lot of charts just for recognition that show some weakness on my analysis. Only work smart and rest hard.
I am also not responsible if there is a loss due to follow my analysis. but you need to know my success rate in trading is very high.
Enjoy the Pips.. Dont forget to like and subscribe.


NZDUSD Maybe a Bearish Crab formingIts a long ways up to the C point, however, if this actually follows the crab pattern we are looking at some serious pips on a trade set up

AUDCAD Bearish Crab possibilityI like this as a potential trade in a week or so if we can break out of the down trend and climb up to the D leg. This is just another trade I am adding to my watchlist

GBPCAD - Potential Dual Pattern CompletionTwo potential bearish patterns completing at the same time :
Shark pattern in yellow (Spotted on both daily & H4 Charts), Crab pattern (spotted on H4 Chart) in light blue
R:R shown is for crab pattern : 2.5 (TP1) and 4.5 (TP2).
I will update the R:R for crab pattern as well both patterns complete. Stay tuned.

EURUSD - Crab Pattern CompeletedCrab pattern has completed and reacted, good to short now.
Aim for TP1 first.

COPPER - Bearish Crab Pattern CompletedBearish price action seen, price respecting PRZ.
RSI at overbought level, good to short anytime.
Aim for 38.2% and 61.8 fib levels.

AUDCAD POSSIBLE BEARISH CRAB FORMINGA lot of last weeks analysis is moving close to the D legs on my charts which is simply awesome. So its time to get charts up for possible trades next week. Just follow my analysis until d leg is hit and watch for reversal. I will update charts with SL and TP as I feel they are valid. Several ideas to watch is better than a few.

USDCHF Possible Bearish Crab formingDefinitely don't jump in on a trade yet. This is just an idea and something to keep an eye on. As it forms I will update.

EURJPY Bearish Crab IdeaThis is on its bullish rise to the d leg. Do not go in this trade until d leg is reached. Big money potential on this one

EURAUD - Bearish Crab Pattern Completed on Daily ChartCrab pattern completed with price slightly above PRZ.
RSI is also showing reversal.
R:R at 1.4 (TP1) and 2.3 (TP2).
Traders may want to find an entry to short on H4 chart.
Do adjust lot size according to your risk management, SL is rather high for this one.

Bearish Crab on TATAMOTORS 1H TFa bearish crab is forming on tatamotors 1H TF, price is slowly reaching point D to complete the pattern . Looks like an excellent shorting opportunity.

GBPZD (PoundKiwi) - Potential Bearish Bat or CrabI am not in the trade yet, since thhe pattern has both characteristics, that of a bat and that of a crab. If it's a Bearish Bat, I'll be waiting for thhe break of the blue full trend and my target will be the dotted trend. But, in thhe case of a break above the Resistannce level in blue. I'm expectinnng a Bearish Crab Formation before shorting.
Trade with care ( This is NOT a signal, just an idea) Compare it with yours and you can share yours in a comment, that would be preferable.

Bearish Crab forming on Punjab National Bank 1H TF.a bearish crab pattern seems to be forming on PNB 1H TF. this pattern also aligns with a butterfly pattern forming on PNB daily chart.
looks like a very promising setup...
