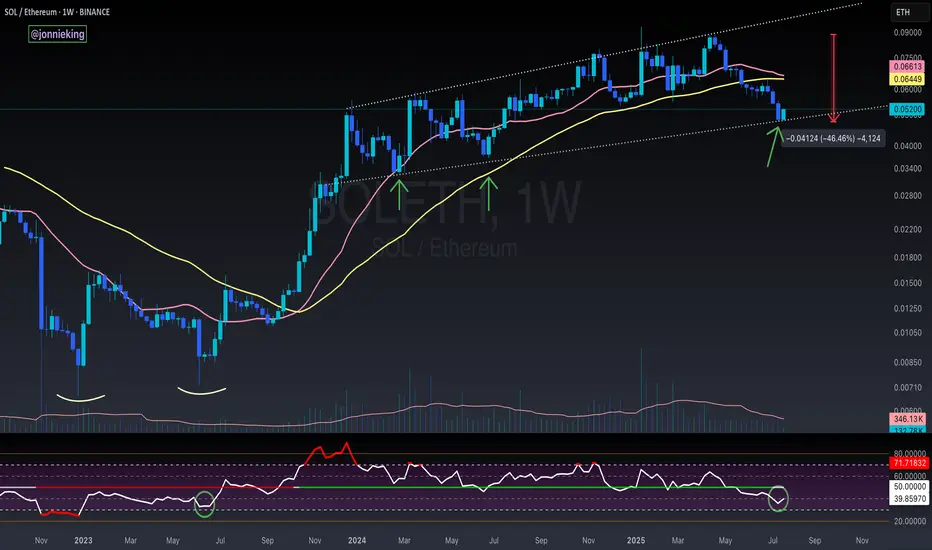
SOL / ETH - Reversal Signs FormingI suspect CRYPTOCAP:ETH has a bit more gas in the tank, but the early signs for the real Alt Season are nearing.
RSI on the weekly is nearing the June 2023 bottom which kicked off the massive bull flag formed on SOL / ETH for the next 2 years.
Still too early to call at this point tho.
Need volume to really burst through in the next week or two.
I’d also like to see BOATS:SOL close the week with a massive bullish engulfing candle.
The bearish cross on the 20 / 50WMA should mark the bottom when it occurs soon.
Bearishcross
Be careful with BTC here..Even tho BTC is up 10% today I would'nt get my hopes all the way up just yet.
Something interesting is happening here.. History shows: every time 20 & 50MA line crossed the 200MA line to the downside in the past, BTC went into a full on bear market.
20 & 50 MA is still just above 200MA, but a cross to the downside could give confirmation we need for a bearish trend.
A good short opportunity in my opinion is therefore a trade with entry at the 200 day mooving average. Stop loss can be placed above 20 & 50 MA or above the decending channel top if you want to give the market more room..
It's a trade worth taking even tho we could break the ressistance and go into price discovery aswell.
A short term target would be a test of the support we had at 56 500 and a intra- day target would be at the low end of the channel at about 50-52k.
Make sure to follow me on X for more weekly updates: @PuppyNakamoto
Our wolf pack are hunting for profits, one block at a time..🐺
BITSTAMP:BTCUSD COINBASE:BTCUSD BINANCE:BTCUSD KRAKEN:BTCUSD BITFINEX:BTCUSD

Descending Broadening Wedge for TSLA?!?Bearish cross on the Williams Alligator.
Bullish Cross on the KST.
$25.00 by 2025 unless TSLA pulls another Solar City-type deal with SpaceX.
If the stock does a 360 it'll only be to $360USD.

Ascending Triangle for Bitcoin??It seems as though BTC is forming an ascending triangle on a micro time frame on a yearly chart.
On the RSI the pattern appears like a bearish pennant.
Bearish cross on the KST.

SPY Bearish Monthly MACD CrossIt appears we might see a bearish cross on the monthly MACD for SPY.
The histogram reached its highest level back in Jun-Aug 2021. The histogram measures the spread between the two EMAs.
We might conclude that we've never seen the market rally as much as this in such a short amount of time. The Covid recovery was truly unprecedented.
The QQQ monthly MACD has already crossed bearish. Might be a leading indicator of what's to come for SPY.

Is Bitcoin trading in a Giant Descending Triangle?On the RSI there appears to be a noticeable divergence, there's a series of higher lows forming an ascending triangle.
The price is displaying a series of lower highs forming a descending triangle.
A bullish divergence or bearish divergence?
A bullish divergence occurs when prices fall to a new low while an oscillator fails to reach a new low. This situation demonstrates that bears are losing power, and that bulls are ready to control the market again—often a bullish divergence marks the end of a downtrend.
Bearish divergences signify potential downtrends when prices rally to a new high while the oscillator refuses to reach a new peak. In this situation, bulls are losing their grip on the market, prices are rising only as a result of inertia, and the bears are ready to take control again.
On the KST there has been a bearish cross on a 1-year chart. In this 5-year chart, it appears as though a bearish cross is on the verge of occurring near term on the Williams alligator.
It's always possible this pattern plays out as a Giant Bullish Flag, expect to see a re-test of the baseline of support & possibly a fake-out to the downside before breaching the horizontal resistance and re-testing ATH's.

Bitcoin daily chart showing several bear signalsThis chart shows several bearish signals on the BTC daily chart, and is meant to provide insight into possible (but not guaranteed) future price movements.
- It shows a rising wedge pattern, traditionally indicating a likelihood of a continuation of the previous trend (in this case: a downtrend).
- It shows a decrease in volume.
- It shows a bearish divergence on the RSI.
- It shows a bearish cross on the MACD.
Traditionally, these are all indicators of a bearish future trend, which can be used to speculate future price movements.
I hope my analysis was helpful.

Descending Channel for GBR?It appears as though GBR is displaying some bearish indicators coinciding with a price decline into a descending channel.
The Williams Alligator is showing a bearish cross and the bands widening pointing to the downside showing bearish strength.

Descending Channel for Bitcoin??!It appears as though BTC is trading in a descending channel or a falling wedge.
On the RSI there's clearly a descending triangle with a series of lower highs.
On the DMI there was recently a bearish cross coinciding with a sharp decrease in the price.
It's likely BTC bounces off the baseline support of the descending channel, look for sell pressure at the downward sloping resistance.
I have drawn two hypothetical scenarios possible in the near term, glta.

Descending Channel for GMG?GMG has been on one hell of a ride, I've been holding this company since before the halt when it was CUSPIS Capital, unfortunately, I sold a majority position way too early once the halt was lifted after nearly 6-7 months.
It appears as though the share price is consolidating into a Descending Channel on a log scale chart and more of a falling wedge on a % gain chart, either way, GMG will need to breach the downward sloping resistance and turn it into support to negate continued bearish momentum.
If support is lost on the pattern look for support around the price ranges where I've placed horizontal red lines which display some previous areas of confluence.
The Williams Alligator is showing bearish strength at the moment, ideally, you want the lines of the Williams Alligator pointing upward which typically happens after a bullish cross, this happens when the green line crosses over the red line upward.
On the DMI there is a bearish cross where I've placed the downward pointing arrow.
In the upcoming week, the DMI looks prime for a bullish cross.

Descending Channel for QC Copper & Gold?It appears as though QCCU is trading in a descending channel, if the bottom support is lost then be very cautious.
On the KST there's been a bearish cross where I have placed the red downward pointing finger.
The DMI is showing a bearish cross where the red line has crossed over the blue in an upward motion, I have placed red finger icons as some other similar previous examples. Keep an eye on the DMI because it's possible the blue line crosses over the red and orange in an upward motion this week if there's going to be a bullish reaction off of the bottom of the descending channel pattern.
The dark red line on the chart represents the baseline of potentially a descending triangle or bullish flag formation, when viewing from a longer-term time perspective than a 6-month chart it becomes more apparent.
This chart is done on a log scale, I will link another chart done differently.
If this was a descending triangle or potentially a bullish flag the baseline of support has been lost.

Bullish Pennant for TNY?On a long-term chart for TNY, it appears as though the price has formed a bullish pennant pattern in blue.
The RSI is displaying a bullish flag.
A bearish cross has occurred on the DMI where I've placed the red downward pointing finger.
The price has noticeably broken the red downward sloping resistance of a Macro descending channel and upon back-testing has acted as support as of this moment, inherently bullish.
If the blue upward sloping support of the bullish pennant is lost ideally I'd like to see bullish buy pressure at the old red resistance of the downward sloping channel, it should act as support again if there's going to be a convincing shift from bearish to bullish sentiment.

Descending Triangle for CURA?Or, possibly this pattern plays out as a bullish flag.
The KST is displaying a bearish cross where I have placed the red downward pointing finger.
Keep an eye on the DMI in the upcoming trading days, if there's a bullish cross it would be very note-worthy for the bullish narrative. Something similar to what happened where I've placed the green fingers.
The share price is nearing the end of the pattern which doesn't happen too often, this could be due to some indecision among market makers and other participants trading / investing in the stock.

H&S pattern for BEV?It appears as though BEV is breaking down from an H&S pattern, the head of the pattern is the red human icon.
On the RSI there's a bearish descending triangle.
On the KST there is a bearish cross where I have placed the red finger point down.
The first price target is 50c.
The second price target is 20c.
Bevcanna claims to have a 210M bottle production capacity but hasn't even tested the public market with a single cannabis beverage offering in Canada.
The facility is in the middle of the B.C woods prone to increasingly dangerous forest fires.
There isn't even a paved road for the winter, it's not an ideal location.
Constant press releases and the company recently issued shares to buy another companies revenues.
Bev grows cannabis & isn't a pure beverage play.

Descending Triangle for BTC?!?!Since my previous chart on Bitcoin linked to this chart, we've seen BTC break-down from an Ascending Triangle after multiple fake-outs to the upside breaking the horizontal resistance; the green upward sloping support has been lost for the being, but is the recent price action merely another fake-out, but to the downside instead?
Well, only time will tell, as for now, I can notice a Descending Triangle forming, and on the RSI there is a similar pattern.
On the KST there has been a bearish cross where I've placed the red downward sloping finger.
It's possible this pattern plays out as a Bull Flag as well.
There's merit for an Inverted H&S pattern, the blue head icon would represent the head of the pattern, and the right shoulder would be the Descending Triangle pattern, but it would obviously have to play out bullishly to the upside as a bull flag for the inverted H&S to occur.

Ascending Triangle for Bitcoin??After breaking out from a crude bullish flag or what could have been considered a descending triangle linked to this post, BTC has consolidated into an Ascending Triangle drawn in light blue.
On the RSI there is a similar pattern as the price action, notice the series of higher lows along with the blue upward sloping support of the Ascending Triangle.
On the KST there's been a breakout of potentially a bullish flag pattern on a macro level, on a micro time frame there's been a bearish cross displaying the red line crossing over downward of the green line.

Bear Flag & a Head and Shoulders for GBR?Since my previous post on GBR, we've clearly seen the price breakdown from what appeared like a bullish pennant or potentially a bull flag, but the bearish divergence was/is too strong...
Currently, it appears as though the price is breaking down from a bear flag with a head and shoulders pattern noticeable. I have placed a blue human head and body icon to represent the head of the H&S pattern.
It could be an ascending triangle with a fake-out to the downside occurring now, the higher low trajectory has been negated at the upward sloping support of the pattern, in the next several trading sessions it will be more apparent.
The RSI is trading in a descending triangle creating a series of lower highs.
The DMI is showing a bearish cross where I've placed the red finger point downward.

Ascending Triangle for TNY?It appears as though TNY is starting to slightly break the blue upward sloping support of potentially an Ascending Triangle to the downside, it would be ideal if the bulls hold this area of support.
In green, I have drawn what appears to be a longer-term trending descending triangle, or, bullish flag, the green downward sloping resistance is currently being tested, it's already acted as resistance approximately 5-6 times since Aug 2018, the more a trend line is tested the more likely it's going to be broken in either direction.
On the RSI it's noticeable that the blue upward sloping support has been broken to the downside, possibly a H&S formation happening where I've placed the human head and body icon with each shoulder being the green curved lines.
On the KST there's been a bearish cross.

Bearish Divergence for GBR?GBR has created lower highs on the RSI since Oct 2018 but the price has continued higher until the blow-off top in late June 2020.
The RSI looks like it's trading in a Descending Channel.
The KST has seen multiple bearish crosses since Dec 2018 and continued lowers highs indicating momentum is fading.
Noticeably the price has broken flush to the downside of a bearish pennant unless it's a fake-out.

Multiple bearish signalsYou see 3 different signals from MACD and RSI
What do you think will happen?

BTC Heading Lower*** Disclaimer - I'm relatively new to TA ***
I've been seeing a head and shoulder play out. On top of this, there's an ascending wedge playing out within that formation. Stochastics showing a bearish cross. There's also a lot of bearish divergence in the RSI. I think we're going to hit support around the $20,000 psychological level before we bounce back up. This could be a good opportunity to short. What do you guys think?

LINK about to break lower towards $11.50 (Buy Support)*** Disclaimer - I am relatively new to TA ***
Moving averages and stochastics are showing bearish signals on the 4 HR . We're in a large descending triangle . Inside that, we're also seeing an upwards broadening wedge play out. I think we're going to break lower to the support around $11.50. This would be a great buying opportunity. If the US reacts positively to stimulus news upon markets opening, this could all be invalidated quickly. I'm bearish , but what do you guys think? This could make a decent short position depending on which route you want to take. I'll personally be putting in a leveraged long at support.

Bitcoin appears to be trading in a Bull Flag!Or, potentially a descending triangle is forming, only time will tell.
On the KST there's been a bearish cross.
The RSI is displaying a potential descending triangle or bull flag similar to the price action.
