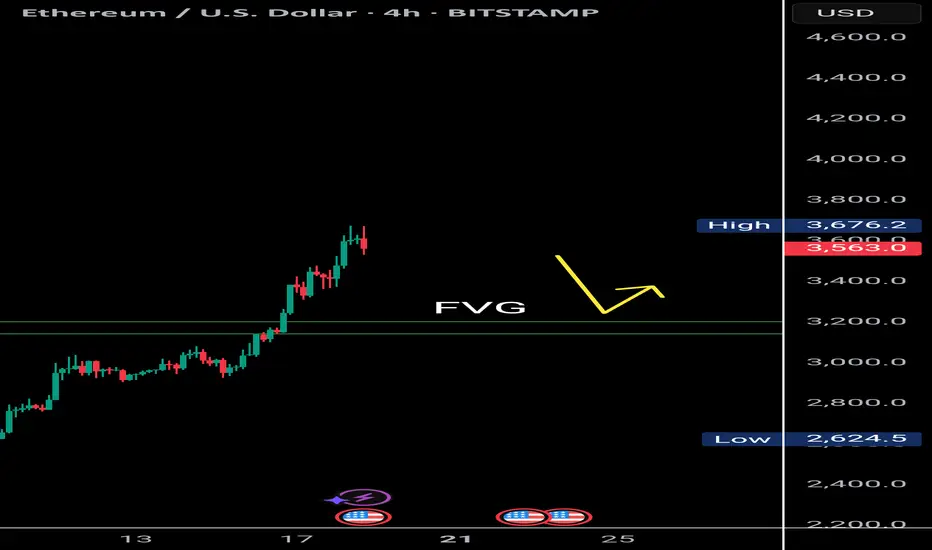
$Eth Faces Double Top Resistance with Bearish RSI DivergenceETH/USDT | 4H Analysis
Ethereum is currently showing signs of weakness on the 4H chart, forming a potential double top pattern around the $3,700-$3,680 range.
Adding to this, the RSI is exhibiting bearish divergence, suggesting that bullish momentum is fading. There's a visible liquidity gap between $3,200–$3,180, which might act as a magnet in the short term. A retest of this zone is likely before ETH attempts to resume its upward move.
Key Observations:
🟠 Double top structure on 4H chart
🔻 Bearish RSI divergence
🕳️ Favorable gap: $3,200 – $3,180
🔁 Watch for price reaction after retest
⚠️ If ETH holds the $3,180 support after filling the gap, a bullish bounce toward higher levels could follow.
📌 This idea is for educational purposes. Trade wisely with proper risk management.
Bearishdivergence
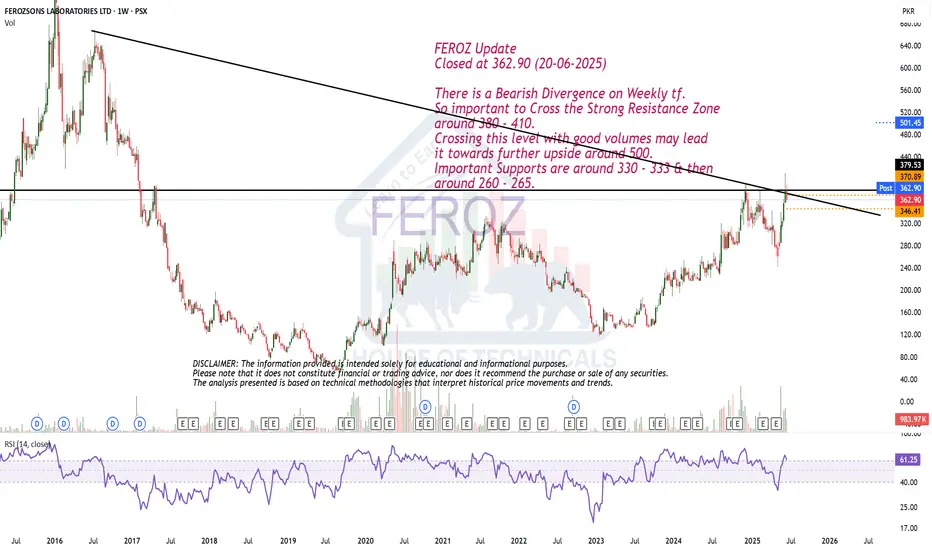
Bearish Divergence on Weekly tf.FEROZ Update
Closed at 362.90 (20-06-2025)
There is a Bearish Divergence on Weekly tf.
So important to Cross the Strong Resistance Zone
around 380 - 410.
Crossing this level with good volumes may lead
it towards further upside around 500.
Important Supports are around 330 - 333 & then
around 260 - 265.
BTC Pullback or Breakout? Key Levels to Watch Around 110KBitcoin is showing repeated rejections from the $110K and $108K zones. Currently, it's moving upward from the $98K area toward resistance, but price action remains compressed between the major trendline support and resistance.
This range-bound structure suggests that a pullback may be imminent, especially as RSI is forming consistent bearish divergence and the MACD is signaling weakness. A liquidity sweep to the downside could occur before a decisive move.
However, if BTC manages to break above the converging trendlines with strong volume, we may see a move toward $110K again for a retest. Watch $106K as an intermediate support. If that fails, further downside may follow.
📌 Trading Insight: Wait for confirmation before entering — don’t jump in without a clear signal.

#Btc Faces Crucial Decision Near Resistance — Bearish DivergeBitcoin is showing repeated rejections from the $110K and $108K zones. Currently, it's moving upward from the $98K area toward resistance, but price action remains compressed between the major trendline support and resistance.
This range-bound structure suggests that a pullback may be imminent, especially as RSI is forming consistent bearish divergence and the MACD is signaling weakness. A liquidity sweep to the downside could occur before a decisive move.
However, if BTC manages to break above the converging trendlines with strong volume, we may see a move toward $110K again for a retest. Watch $106K as an intermediate support. If that fails, further downside may follow.

Price moved up as expected.
Closed at 41.52 (05-06-2025)
Price moved up as expected.
However, 45 is still the resistance,
which needs to cross and let the stock
print HH.
Though there is still a bearish divergence
so the price may see some down side, but
It is safe as long as it is above 33.

Bearish Divergence played wellSNGP Analysis
Closed at 117.34 (29-05-2025)
Bearish Divergence played well & dragged the
price from 129 -130 towards 113.
Now, Seems like HL has been printed around 113 - 114.
If this level is broken, we may witness further downside
towards 102 - 107
Immediate Resistance is around 123 - 125 & then
around 130 - 132

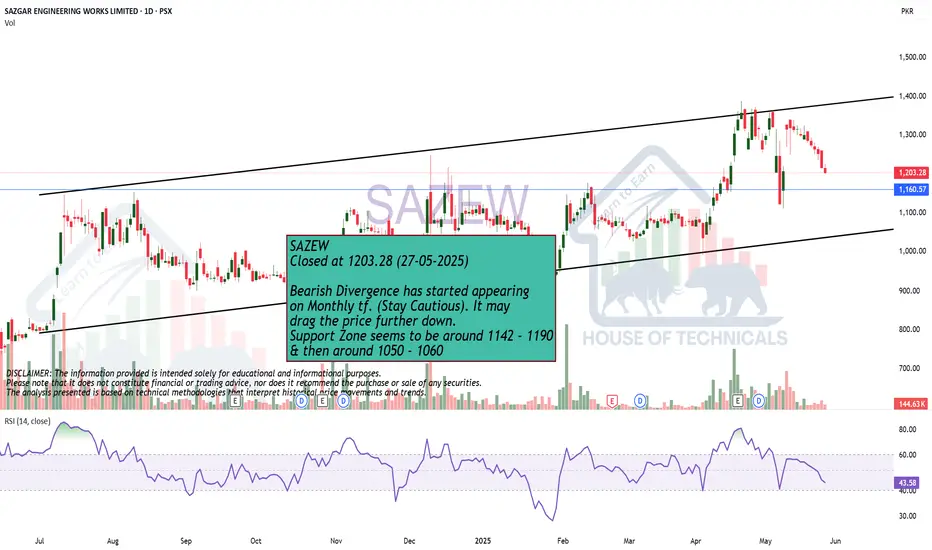
Bearish Divergence has started appearing on Monthly tf.SAZEW
Closed at 1203.28 (27-05-2025)
Bearish Divergence has started appearing
on Monthly tf. (Stay Cautious). It may
drag the price further down.
Support Zone seems to be around 1142 - 1190
& then around 1050 - 1060
Bearish Divergence has appeared.
Bearish Divergence has appeared.
Better to wait for a better price
zone and a Support around 134-135
(if it comes).
Channel bottom is around 124 - 125 but
it seems unlikely so far. However, possibility
is still there.

$BTC Bearish Divergence Confirmed | Correction ImminentBitcoin has formed a clear bearish divergence on the daily timeframe, accompanied by declining volume, an inverted hammer candlestick at resistance, and a MACD crossover to the downside. Price has also retested the upper trendline but failed to break higher.
Key levels to watch:
First support: $96,000
If broken, further downside to $80,000
Ultimate support around $60,000 if market sentiment weakens further
Also, be cautious as today's Moody's downgrade of U.S. credit may increase market volatility.
This presents a solid short opportunity if BTC fails to reclaim key resistance levels.

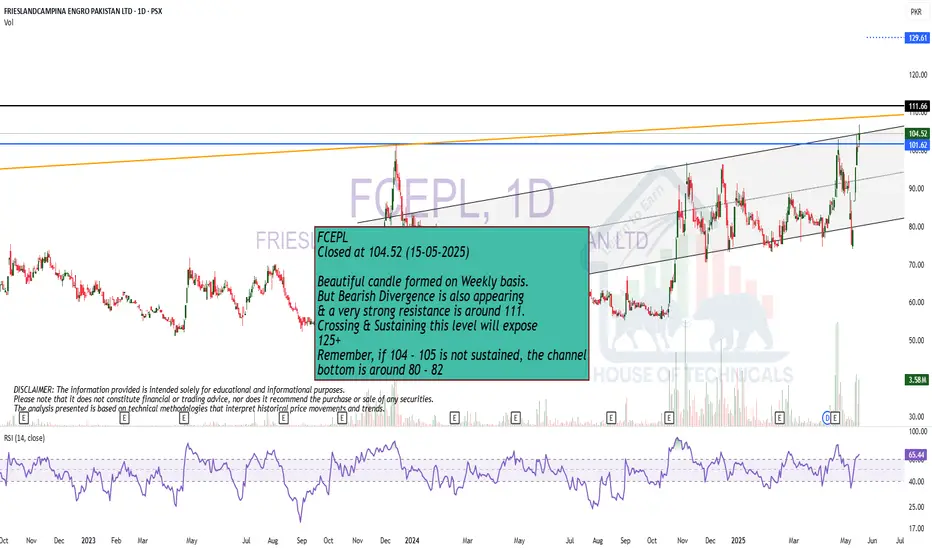
Beautiful candle but Bearish Divergence is also there..
Beautiful candle formed on Weekly basis.
But Bearish Divergence is also appearing
& a very strong resistance is around 111.
Crossing & Sustaining this level will expose
125+
Remember, if 104 - 105 is not sustained, the channel
bottom is around 80 - 82
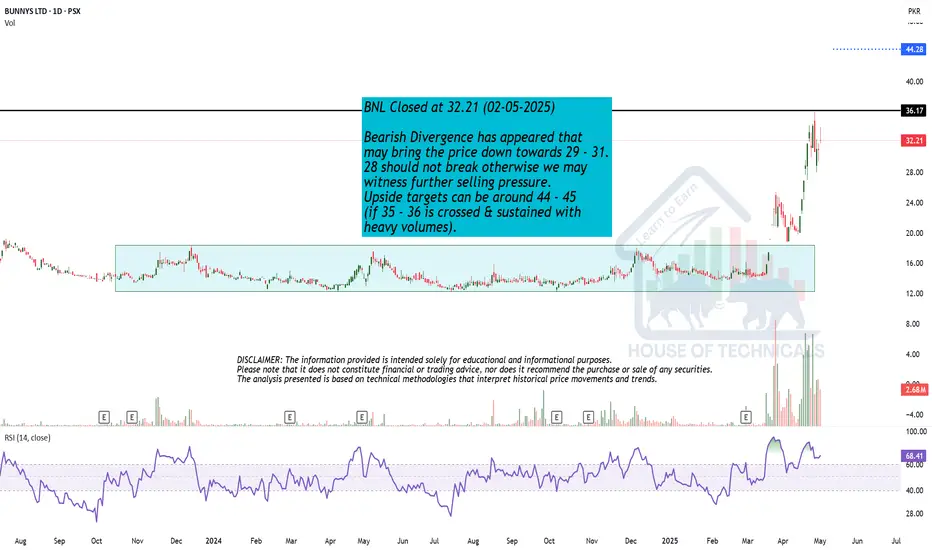
Bearish Divergence has appeared.
Bearish Divergence has appeared that
may bring the price down towards 31 - 32.
28 should not break otherwise we may
witness further selling pressure.
Upside targets can be around 44 - 45
(if 35 - 36 is crossed & sustained with
heavy volumes).
Bearish Divergence appeared.Bearish divergence appeared on Daily as well as
Weekly TF.
Strong resistance is there around 127 - 129.
Once this level is Crossed, we have open ways
towards 145 - 147
On the flip side, we have a good support around
120-122. However, breaking 116 this time will bring
more selling pressure towards 113 initially.

Seems like Bearish Divergence is somewhat Sync now.
Closed just above Weekly Trendline Support
(i.e. above 115000)
as mentioned during last week.
However, the Daily Candle Closed below the
Trendline Support; that means 116000 is the
Immediate Resistance that needs to Cross &
Sustain.
In case of Selling, we may witness 112800 - 112900
as Important Support.

Bearish Divergence has appeared.Bearish Divergence has appeared.
Immediate Support lies around
203 - 208
Next Support lies around 178 - 188
Bullish Momentum will resume once
it will cross 222.

No Bearish Divergence on Monthly Tf.No Bearish Divergence on Monthly Tf.
But 39-40 is a Very Strong Resistance
that needs to Cross & Sustain with Good Volumes to
reach 45 - 46 & then 50+
We should not ignore that it has taken Support
from a Very Important Fib level around 32.40
Monthly Closing above 33.60 would be a Very Healthy sign.
So any dip towards 32.50 - 33.50 can be a Buying Opportunity.
However, it should not break 31.80 otherwise we
may witness further Selling Pressure towards 28.50 - 28.70

Bearish Divergence on Weekly TF.Bearish Divergence on Weekly TF.
Resistance lies around 225 - 235
Currently moving in a Rectangular Channel.
Crossing 222 - 223 will trigger more positivity
towards 235 - 240 initially and then around 250-260.

Bitcoin Double Top Signals Caution: Key Support Zones to WatchCRYPTOCAP:BTC previously formed a strong double bottom around the $74,500 level, which led to a bullish rally pushing the price up to a saturation zone near $86,000. However, current price action suggests a double top formation — a classic bearish reversal pattern. This aligns with RSI trendline rejection and signs of bearish divergence, reinforcing the bearish sentiment.
The key question: Is this a correction or the start of a deeper dump?
If BTC holds above $79,000, it may just be a healthy correction.
A breakdown below $79,000 brings the next support near $76,000 into focus.
If that fails, Bitcoin could revisit the $69,000 zone, which aligns with earlier consolidation.
Traders should monitor RSI closely and watch for reaction at the support zones. Opportunities exist for both short-term scalps and long-term positions near key levels.


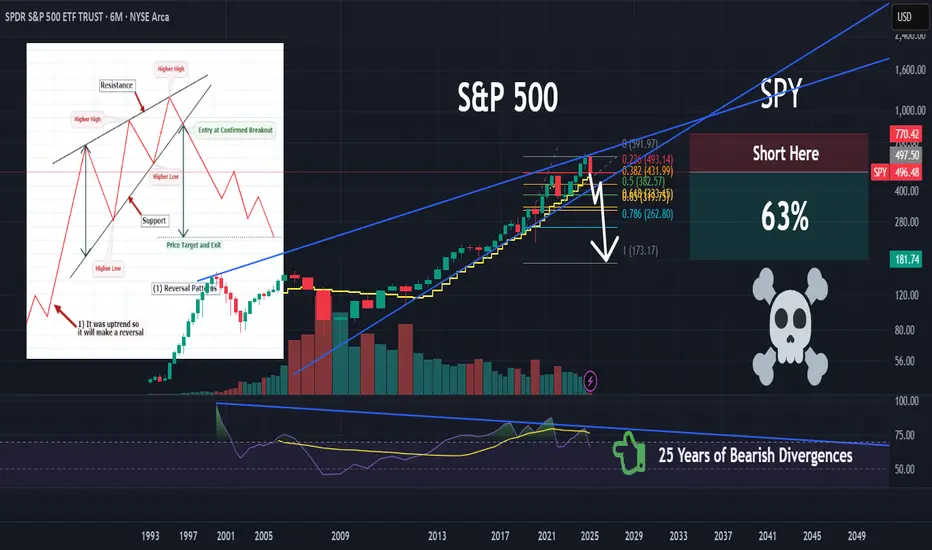
SPY | Things Could Get Ugly | ShortSPDR S&P 500 ETF Trust seeks to provide investment results that, before expenses, correspond generally to the price and yield performance of the S&P 500 Index. The Trust seeks to achieve its investment objective by holding a portfolio of the common stocks that are included in the index (the "Portfolio"), with the weight of each stock in the Portfolio substantially corresponding to the weight of such stock in the index.
Cup & Handle Formation in process but..Cup & Handle Formation in process but Yes, there is a Bearish Divergence
on Weekly Tf.
Resisted exactly from the mentioned level around 116-117.
Could not Sustain this level.
Now Weekly Closing above 104 - 105 is important.
Next Support lies around 96 - 97
If 118 is Crossed & Sustained, we may Target around 145 - 146.

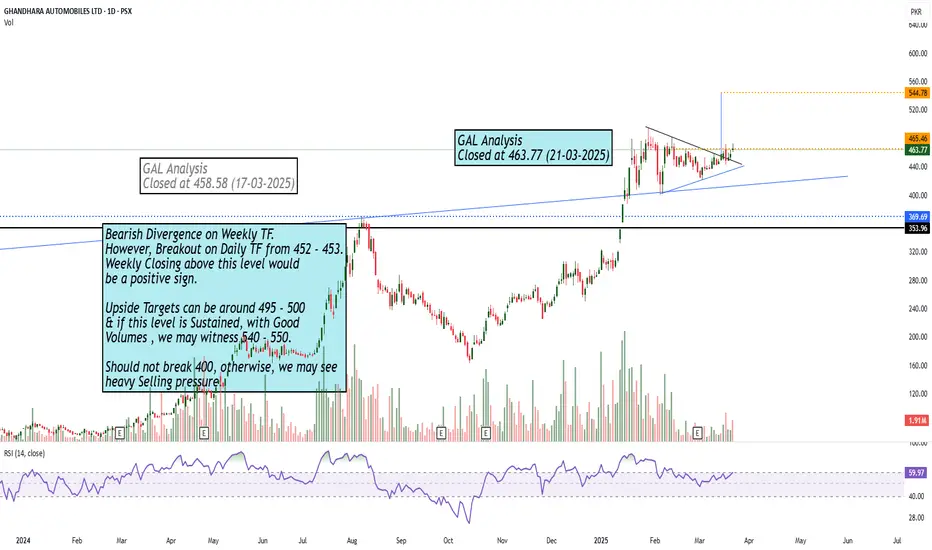
Bearish Divergence on Weekly TF but..Bearish Divergence on Weekly TF.
However, Breakout on Daily TF from 452 - 453.
Weekly Closing above this level would
be a positive sign.
Upside Targets can be around 495 - 500
& if this level is Sustained, with Good
Volumes , we may witness 540 - 550.
Should not break 400, otherwise, we may see
heavy Selling pressure.
Cup & Handle Formation!Bearish Divergence on Daily & Weekly TF.
Now Strong Resistance is around 119500.
Cup & Handle Formation appearing at the Top.
Support Levels mentioned.
