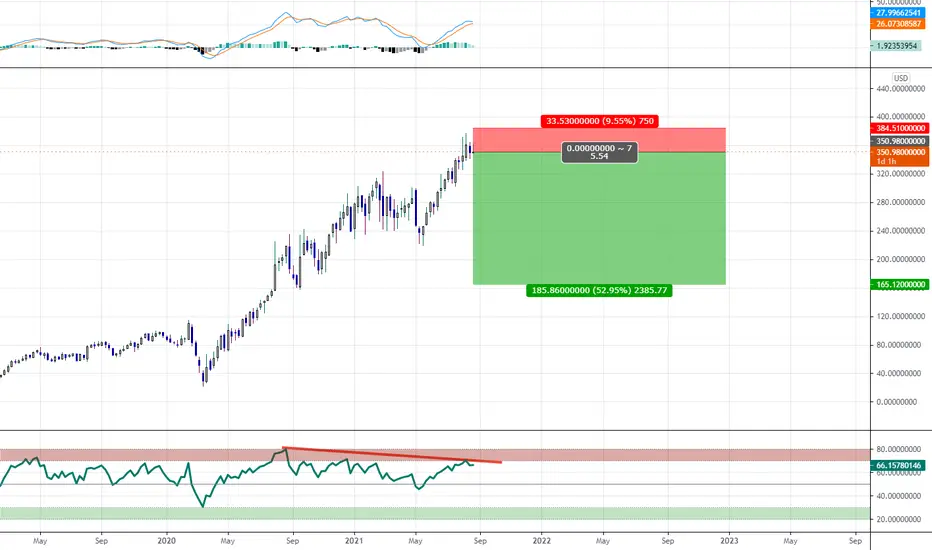
GOING SHORT IN XAGUSD BY TRADING STRATEGYBullish Indications
1. Higher Highs and Lows
2. Trend line not broken
Bearish Indications (BIASED SHORT)
1. Rejected from Resistance Area
2. Double TOP OR BAT Pattern Formation In Progress
3. AB=CD Reversal Pattern
4. Formation of Bearish Divergence
Bearishdivergence

USOIL: Bearish Butterfly & 3 Line Strike with Bearish DivergenceWe have Bearish Divergence on the MACD at the PCZ of a Bearish Butterfly and a 3 Line Strike to go along with it. I think we will make our way below the trendline then breakdown fast to the weekly lows.

EURJPY Short Term Sell IdeaD1 - Price is bouncing lower from a key resistance zone.
Bearish divergence.
Most recent uptrend line breakout.
H1 - Bearish trend pattern.
Currently it looks like a correction is happening.
Until the two strong resistance zones hold my short term view remains bearish here.

Dax - Looking To Sell Pullbacks In the Short TermH4 - Price respected a key resistance zone and bounced lower.
Bearish divergence.
Lower lows.
H1 - Bearish trend pattern.
Currently it looks like a correction is happening.
Until the two strong resistance zones hold my short term view remains bearish here.

AUDCAD - Looking To Sell Pullbacks In The Short TermD1 - Continuing bearish divergence.
Currently it looks like a correction is happening.
Price still has room lower towards the key support zone.
H4 - Bearish convergence.
Until the strong resistance zone holds I expect the price to move lower further after pullbacks towards the key support zone.

Bitcoin: 3 Falling Peaks In Harmonic RangeBTC is trading within a Harmonic Range today and while the Bearish Shark did perform well last night, ultimately price has come back up and created a Bearish Bat at the VAH while showing Bearish Divergence on Volatility. As the 89SMA approaches i'd want to see BTC come down towards and break the confirmation line to begin a move down to $16,500-$15,000 to complete the bearish wave down and start fresh on the new week.

Bearish ABCD and Retest of the Daily Open on MaticMatic has a Bearish ABCD at the Daily Open and is showing a Bearish Divergence on the Volatility Indicators, it may be setting up for a BAMM to the 78 Cent Area.

FOMC Economic Projections Effect on GoldOANDA:XAUUSD
**Repost from Dec 14th 2022 since the original post disappeared**
Hello all TradingView speculators,
In my opinion, I think there was an overreaction from the market's participation on the CPI numbers that was announced to be lower than expected. In addition to this, some technical indicators are showing us some signals to be careful on the buy side from bearish divergence signal between the price and RSI on 4H timeframe. This indication does not mean that the trend will reverse immediately but it indicates that the current trend has chances of stopping and turn into either sideway or downtrend in short term.
Based on the current price level, Risk to Reward Ratio seems to be in favor of the bears. However, I would wait to see the price action in 1H timeframe tries to test 1815 first and if it fails then I believe that follow sell position after this price action fails to go above 1815 and if price makes a lower low below 1804 can be a worthy trade

BTCUSD Bearish Projection For The Remainder of the WeekWe have this Confirmed Bullish 3 Line Strike on the 4HR at the level of the macro 786 retrace from low to high, we don't have Bearish Divergence but it does lead me to think we get a midterm pullback back to the 16k Level likley within the week before looking to continue higher:

GOING SHORT IN XAGUSD BY TRADING STRATEGYBearish Indications
1. Trend is Mature Enough
2. Bearish Engulfing
3. Retest Resistance Level
4. Bearish ABCD Pattern
5. Bearish Divergence
Bullish Indications
1. Dow Theory Higher Highs and Lows
2. If it breaks the resistance it will continue its rally
3. According to seasonal data silver remains bullish in December

USOIL Bearish ABCD With Bearish Divergence on the MACD and RSIOil has a nice amount of Bearish Divergence at the PCZ of a Bearish ABCD and it looks ready to break the midterm uptrend and continue down on the macro.

CADJPY Bearish ideaW1 - Price respected the psychological level 110 and bounced lower.
Bearish convergence.
D1 - Currently it looks like a pullback is happening.
No opposite signs.
Until the strong resistance zone holds I expect the price to move lower further after pullbacks.

Bearish Crab on USOIL: Bearish Continuation Expected This WeekWe have a Bearish Crab with MACD Bearish Divergence at Last Week's high on USOIL after a reaction to the PCE report. I'm expecting that we have reached a top for the week and that we will continue to make the bigger move to the downside to continue the trend started by the 4HR Bearish Bat Trade Below.
I will be waiting for the stock market to actually open before taking the trade if it's still within the Pattern Completion Zone by then.

AUDUSD Short Term Sell IdeaD1 - Price has reached a strong resistance zone.
Bearish hidden divergence followed by continuing divergence.
H1 - Bearish trend pattern.
Currently it looks like a correction is happening.
Until the two strong resistance zones hold my short term view remains bearish here.

Weekly Dark Cloud Cover and Weekly RSI Bearish DivergencePotential Weekly Dark Cloud Cover while showing RSI Bearish Divergence. The MACD will be crossing bearishly soon too.
AUDCAD: Bearish Divergence at Last Week's HighThis is a pair I'v been looking to short again for awhile now due to the trend and now i'v got some Bearish Divergence to justify entering and the nice extra bonus from the news of the US Trade Deficit Increasing. I think this will stir up more demand for the CAD against alot of other Currencies but more particularly against the AUD.
This may also put downwards pressure on the price of US Oil but thats for an entirely different trade.

Gold - Looking To Sell Pullbacks In The Short TermD1 - Price has reached a strong resistance zone.
Bearish divergence.
H1 - Bearish convergence.
Currently it looks like a pullback is happening.
Until the strong resistance zone holds my short term view remains bearish here.

TPOR Triple leveraged Transportation ETF SWING LONGFundamentally, the stabilization of fuel prices helps push things down the road.
A possible rail strike if no averted by Congressionaly action will cause a big macro effect.
TPOR was downtrending into the end of September then reversed starting a trend back up.
I see this as a good long swing buying initially now and then every time the price
pulls back to the Hull 150 moving average trend line in back or even drops below it
when the faster moving average ( Hull MA 20 in Blue) reverses from going down to
up or crosses the long MA from below. I will exit when the relative strength tops out
and shows bearish divergence.

CHZUSDT - SHORT - BEARISH DIVERGENCEHello Hello Trader ,
Please if you like the ideas , don't forget to support them with likes and comments.
Thank you very much.
Here we go ,
I want to tell you about the CHZ-USDT hidden bearish dívergence.
On this chart ,
We can see, while the price is going down, the RSI is moving up. This is called bearish divergence. So it's likely for the price to continue going lower on a short-term basis.
All further details are shown on the chart.
Goodluck!

AUDCAD - Bearish Bat on an exhaustion move upAUDCAD completing a Bearish Bat at the 0.9050 zone. The Daily chart is also showing us a Bearish Divergence on the RSI.
I would be looking into the lower timeframe for a short entry

Weekly: NASDAQ Bearish ABCD Still Awaiting A 50 percent PullbackWe continue to divergence on the weekly as we hit the symmetrical ABCD move towards the PCZ im expecting something big here.

EUR/GBP Bearish DivergenceEuro Sterling H4 potentially will continue weakening towards classic support at 0.8584 supported by bearish divergence. Euro Sterling will weaken as long as it doesn't penetrate the resistance at 0.8700.

USDJPY At Monthly Candle Close Resistance and Bearish ButterflyUSDJPY is slightly above the PCZ of a Bearish Butterfly and right at Monthly Candle Close Resistance with Bearish Divergence on both the MACD and RSI this will be the last line of defense for the JPY.
Here below you can see the Monthly S/R zone:
