Not so nice picture for BTC near termBearish divergence on MACD histogram and on RSI is not so pretty picture to see from bulls perspective. And seeing that on 12hrs chart, it's really ugly. Volume drops from the middle of this move and all that could indicate that we might see some kind of move reversal. I'm not saying this bull run is over, and not saying that we are going to 100k tomorrow. I just say what I see. And it's quite normal to see the exhaustion of this upward move. We should be realistic... It's very healthy for BTC to pull back and consolidate for further upside movement. Buyers could show up and erase all this, but for now...
Bearishdivergence

BTC with Bearish Divergence ALERT !!!Bitcoin shows massive bearish divergence and may retest 42.5 K zone to regain balance. Remember a little bit of correction is always necessary for a healthy market.
Trade Safe ...

RSI Bearish Divergence: Ascending Broadening Wedge.If we were to go based off of textbook targets then the next stop of 0x would be around 52 cents but if we wanna be conservatize i'd say just to target the 618 for profit taking as that will yield more than enough profit to justify the trade.

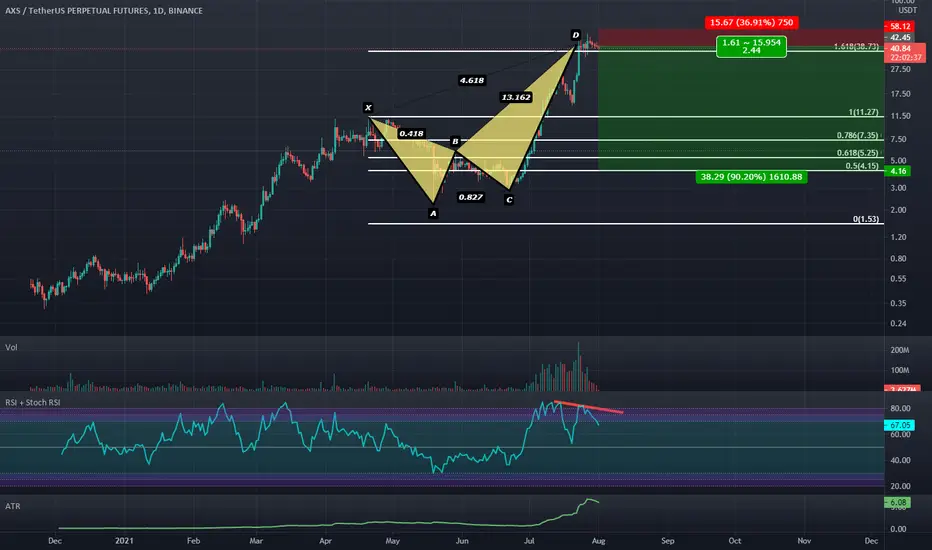
Bearish Bat with Bearish Divergence: 2 targetsBack with another setup with bearish potential on this one.

SPY - Cautious: Bearish DivergenceAs noted on the QQQ chart I shared yesterday, I'm noticing some bearish divergence from Price & RSI. Also riding along an upper trendline shown in red. As of now, the lower trendline in green has shown support. We've had 2 instances of similar divergence which resulted in a very fast 2-4 day drop which got bought back up just as fast. Interested to see how this one plays out!

Weekly: Dark Cloud Cover Head and Shoulders Entry.We have a potential Head and Shoulders entry being confirmed with a Dark Cloud Cover on the Weekly timeframe

Time to be cautious: Bearish divergence on the shorter timeframeIf you find the analysis useful, please like and share our ideas with the community. Any feedback and suggestions would help in further improving the analysis!
Quick glance: ETH has steadily gone up and is hovering around the $3100 level. It has been a dream run so far for the ETH enthusiasts. However, it might be prudent to be cautious right now as a bearish divergence is appearing on the 4-hour time-frame.
Market in the last 24hrs
The last 24 hours were actually pretty bullish for ETH. Markets were fired up and we saw massive positive momentum across most Altcoins.
Today’s Trend analysis
BTC inched closer to the $46,000 mark. The king of Altcoins, Ether, would not no way lag behind. It had a similar rally and surpassed the $3100 mark. The anticipation of the ‘London Hard Fork’ caused a massive rally in ETH in the past 2 weeks. If we look at the price, it has been forming higher highs. However, if we look at the corresponding RSI, we notice that the RSI is not exactly making higher highs. And this is a bearish divergence.
It suggests that the trend might be getting weaker and we might see a reversal. That being stated, there might be false ‘bearish divergence’ signals as well.
The trendlines would help enter short term trades in case ETH breaks out or breaks down. The trendlines would be reliable as they are in place since mid July and follow price action.
Price volatility remained extremely high at approximately 9.01%, with the day's range between $2893.21 — $3154.57
Price at the time of publishing: $3109.57
ETH's market cap: $363.50 Billion
Out of 11 Oscillator indicators, 7 are neutral, 3 are bearish and 1 is bullish.
Out of 15 Moving average indicators, 1 is 'NEUTRAL', none are bearish and 14 are bullish .
Indicator summary is giving a BUY signal on ETHUSD .
Volumes have remained high in the past 24 hours.
----------------------------------------------------------------------------------------
The analysis is based on signals from 26 technical indicators, out of which 15 are moving averages and the remaining 11 are oscillators. These indicator values are calculated using 4 hour candles.
Note: Above analysis would hold true if we do not encounter a sudden jump in trade volume .
----------------------------------------------------------------------------------------
Keep supporting:)
-Mudrex

#BTC bearish divergencehey guys, here is bitcoin forming bearish divergence. so be careful price can drop 40k zone.

Daily bearish divergence + rejected 200 day MA (BTC) Greed killsGood afternoon traders,
I've been waiting for all the euphoric traders to catch themselves slipping acting like "up only" and the bull market is back on and today we're currently down $2000 from the local top where we rejected the 200 day MA and also printed a bearish divergence (see momentum oscillator - stoch rsi for reference)
Bearish divergence:
1) Price action prints a higher high
2) Momentum oscillator prints a lower high
(Indicating weakness in the trend)
If this plays out we should retest $39,999 at least and if this holds it's possible we head higher in the short term but if that support fails this will be a confirmed fake out (liquidity grab) while institutions (whales) get out of their longs and then sell while retail fomo's into a long at the top and gets greedy/euphoric.
The markets are designed to play against human emotion and the masses (90%) while the 10% countertrades their every move and get hilariously rich over the long run if they stay consistent with this formula.
Pay attention to the market when most are fearful and note what happens next, same goes for when most are greedy.
They provide liquidity for whales to get out of their previous position while they are entering new ones.

BTC- H4 - RISING WEDGE - TARGET 40'640 !Looking at the H4 time frame, a Rising Wedge pattern has been confirmed, opening the door for
a technical target of 40'640 !
Additional support to this expected scenario will be given by a next H4 closing below TS, currently @ 43'803
Below next support to look at will be MBB @ 42725 ahead of KS @ 41'327
In the meantime, watch carefully upcoming development in the next couple of hours in screening very closely price action on
H1 and shorter time frames which will help you to validate or invalidate the above scenario explained.
Finally, today's closing level on a daily basis will also be important as on D1 there is a bearish divergence on RSI ....
Have a nice end of the weekend and all the best.
Take care.
Ironman8848

Short Position Set UpShort Entry price = 10.287
Stop Loss = 11.644
Take Profit = 8.239
Risk:Reward = 1.67
Reasons for entry:
1) 5 waves according to Elliott Wave Theory indicate a reversal ahead.
2) Bearish divergence on MACD and RSI
3) Much lower volume during the 5th wave compared with the 3rd indicates a reversal ahead.
4) Bitcoin has been trending lower meaning this 5th wave is artificial and the trend should revert back to the mean and drop like most other coins.
GL on this one. I won't be taking it as I have important commitments I need to focus on for tomorrow but I think it is a good trade.
This has a wide SL and TP (over 10% SL), so consider reducing your exposure to 0.5x to reduce your potential losses.

Head and Shoulders to fill the gap.We got a head and shoulders near the top of a range potentially preparing to fill a gap to the downside.

BTC Short PositionI have gone short again with 1x this time with a maximum loss of around 4.5% and a target profit of around 8%.
I ended up taking a tiny profit after yesterdays trade as the market did not break down as low as I wanted.
I think we have now finished the upward trend and it will break lower from here.
Why will we break lower?
1) Wave (iii) was almost 2.618 x wave (i). When wave 3 is as extended as this, the 5th wave will usually end when it hits 1.618 x wave (i) (added onto the end of wave (iv)). The top of wave (v) is exactly the 1.618 extension of wave (i), so I think we have topped out.
2) We have confirmed the 3rd touch of the white downward sloping trendline as a resistance has already been confirmed by bearish reversal candles.
3) We are seeing bearish divergence on the 3,4, and 6 hour charts on RSI and MACD.
Issues with this trade?
1) The lower time frames (1h and 2h) only show bearish divergence on RSI and not on the MACD histogram.
2) Wave (v) has spanned over much longer than wave (i). However, I believe that this is due to wave (v) being extended.
3) Wave (v) appears to have 3 waves instead of 5. This seems inconsistent with Elliott Wave theory but I have seen many wave 5's ending with only 3 waves.
Over I think this is a solid trade and I have set a stop loss to get out if we do break higher.
Target levels?
1) 38k - 39k
2) 36k - 37k
All the best, and good luck!

4 Hour Bearish Divergence at PCZ of Bearish GartleyA quick attempt to try to catch a Bearish Gartley the stoploss isn't too wide so if it fails you wont be down much.

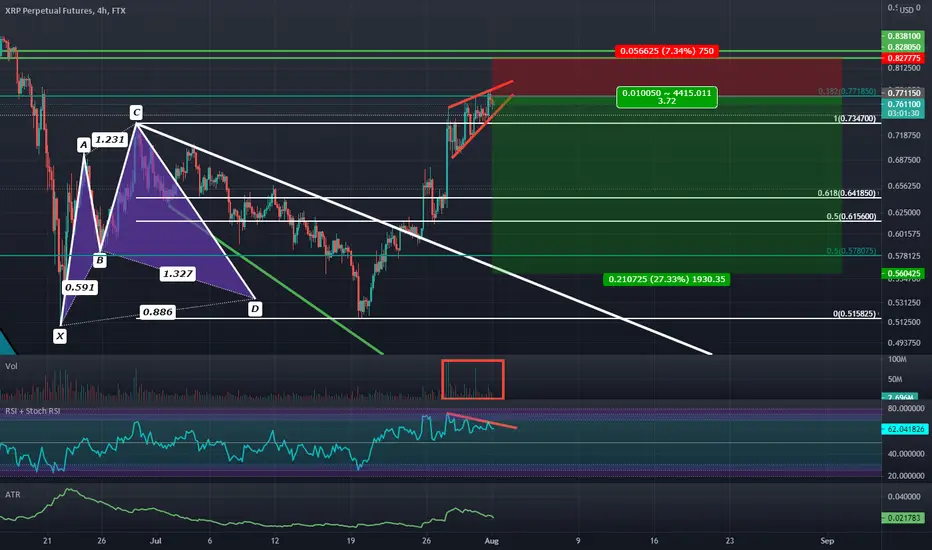
Rising Wedge on 4 hour with Bearish DivergenceToo my surprise XRP actually broke out of it's descending broadening wedge and reached full measure moves; i certainly flipped bearish on this one too soon the first time. But now that we have reached full targets i would expect that any bearish signal we get up here will carry more weight so i will be getting bearish up here again to see if i can catch another big move.
RSI Bearish Divergence at 1.618 Log-Scaled PCZ of a Bearish CrabVery Similar to the Bearish Log Scale Butterfly i found on Bitcoin. This setup however does not have the best risk to reward due to the high volatility of this coin. i suggest that if you trade it not to risk a huge amount of cash.
4 Hour Bearish CypherLINK may potentiall6y reverse between the .786 and the .886 retrace as it shows Bearish RSI Divergence and appears to be is overbought territory.

Reversal signals on the 4h chartBTC is showing trend reversal signals on the 4h chart. Volumes are decreasing and a bearish divergence has formed on the RSI. Waiting for it to happen on the next days.

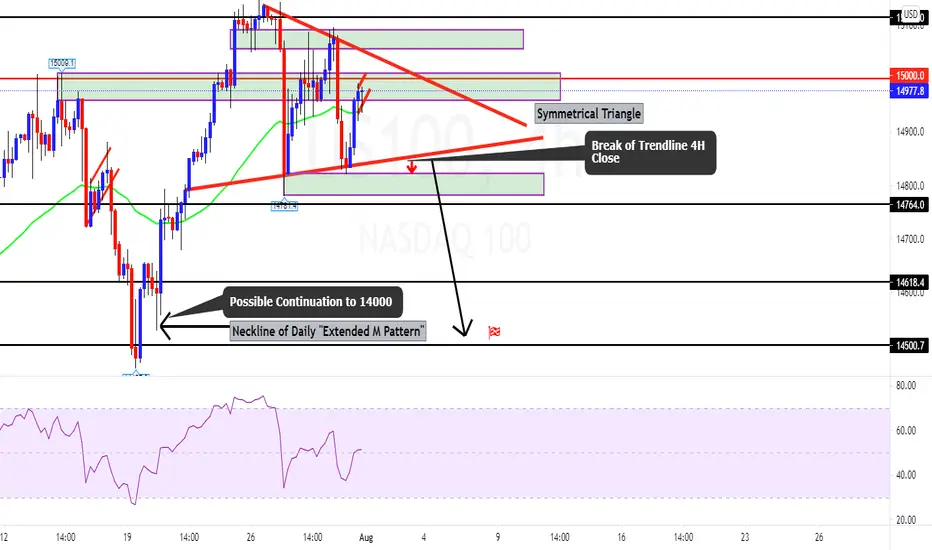
NASDAQ August AnalysisDaily bearish divergence. 4H symmetrical triangle. Currently rising flag pattern on 15 min inside the 4H zone indicating possible sell from zone. Once 4H closes below outside of triangle expecting price to go to 14500. That is neckline of the "Extended M Pattern". Since there is Daily bearish divergence it's possible for continuation from Daily "Extended M Pattern" neckline 14500 to 14000.
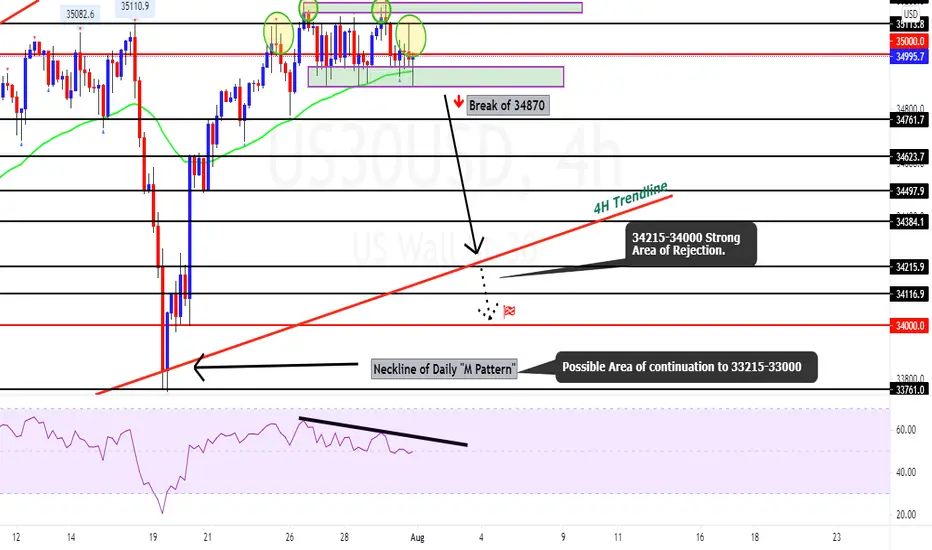
US30 August AnalysisWeekly and 4H bearish divergence. There is also a Daily "M Pattern". Expecting price to breakout of consolidation below 34870. Price may reject 4H trendline area. Strong possibility it breaks trendline and reaches daily neckline level of 34000-33761. If it does reach neckline look for possible continuation to 33215-33000 because of weekly bearish divergence and Daily "M Pattern".
1 Hour Rising Wedge with MACD and RSI Bearish DivergenceWe got some Bearish Divergence and a potential Rising Wedge on the 1 Hour Timeframe going to try catching a reversal here.

BTC - D1/H4 - 38.2 % FIBONACCI RETRACEMENT @ 42'894 !D1 : Yesterday's price action triggered for the first time a closing level above the clouds with an intraday high @ 42'411, not far away of the
38.2% Fibonacci retracement @ 42'894, which is the next significant resistance level after 40'000.
So what next, now ?
Despite this sharp recovery since over the last couple of days from a low below 30'000, the BTC remains, for the time being, still in a broad
downtrend, meaning still below the Daily downtrend line resistance (in red on the chart); interesting to note that this important resistance
level coincides roughly with the level of the 38.2% Fib ret above mentioned !!!
Looking at the RSI indicator which is currently above the 70.00 (72.36), it looks a little bit tired... today's and upcoming price action should be
watch at very carefully.
H4 : This time frame is showing a rising wedge pattern in progress, couple with a RSI double bearish divergence which already triggered a downside
correction.
Watch 40'371-40'234 as first support area ahead of 39'560 (KS) and rising wedge support line; a failure to stay and hold sustainably above 39'500 would
confirm a top in place in opening the door for lower levels towards the H4 clouds support zone, currently around 37'300-35'000)
On the upside, a breakout of the former high @ 42'411 would directly put the focus on 42'894 ahead of 47'095
Watch also Chikou (lagging span) on D1, currently in the middle of the clouds (41'705) as an upside breakout of the clouds would also give more support for further upside.
Finally, watch also shorter time frames to get intermediate signal (s) which will allow you to detect early signs of trend reversals and last but not least watch the clouds
and Mid Bollinger Band on each time frame you are looking at :-)
Have a nice weekend.
And if you find my analysis as a good added value for you, please do not forget to like it and for those who do not follow me yet, please add Ironman8848 on your following list.
Take care and have fun.
Best
Ironman8848

Amazon (also) Appears to be in Wycoffian DistributionThe main chart has the Wycoffian distribution spelled out and if you want to check it against the criterion you can follow the link below, hit ctrl-f and search for "Distribution: Wyckoff Events" and you will be right there. Not everything is annotated, the chart would be way too cluttered.
school.stockcharts.com
www.ltg-trading.com
As it stands I am still waiting for my entry to buy some OTM puts( I do have some SPXU and SQQQ calls that are going well but I don't feel the stress is worth it). Very often when the price breaks through the ice there is a low volume rally to the ice, or at the lower end of the ice range and that gives you the best chance for an entry into an impulsive move. In other words almost any continuation pattern around the ice should have a high probability of breaking down bearishly and any bearish patterns (like rising wedges) are definitely bearish.
On the weekly chart we clearly see that the price action has been rangebound almost straight sideways but the On Balance Volume itself and the EMAS have been trending downward with the 20EMA bearishly over the 10. What remains to be seen is if the 100 OBV EMA will hold the OBV or the 10 and 20 OBV EMAs. If the obv EMAs stack fully bearishly then the price will look like a cat swiped it off the table. We can also see that the MACD has a lot of bearish divergence as well as the MACD histogram. The MTF VSTOP reinforces the trend as being bearish by providing resistance that is automatically and dynamically drawn, so I can't mess it up.
The monthly chart below confirms that the ice isn't some random price action I observed, it was the long term VSTOP support. Back testing the chart shows that when the MTF VSTOP gets broken on the monthly we can expect some wicking below the 20 period SMA. Likewise, when the MACD crosses the signal line bearishly or goes red the 20 period SMA is a good place to accumulate. Even in late 2014 when we closed a monthly candle below the 20 we were fine. I have not shown the OBV in the chart below because it does not have any serious signals except the OBV has been trading around the 10 EMA.
Some Macro stuff
The only way we go much below the 20 period SMA is if we have a the NASDAQ bubble completely pop or a financial crisis like 2008. That scenario is certainly on the table given how horrific the news cycle appears to be and if international trade slows and the news picks up about supply chain problems Amazon is going to be hit particularly hard. Then we start looking for a long term value buy at the monthly bollinger band which is conveniently right around the ascending triangle. It is also rather convenient that the price is distributing right above the target of the ascending triangle. Pure support and resistance traders would be looking for the top of the triangle to be tested as support anyway. Debt is also getting expensive and so there is less easy money for firms and with inflation picking up there should be less items consumed at a higher price, which means less orders from Amazon
Please have a look at my Wycoff chart on the NASDAQ Futures if the subject interest you.
