Bitcoin Weekly Bearish Signals. Likely to go lower
Today I will show some weekly Analysis which is showing many Bearish signals.
Firstly the RSI has a weekly bearish Divergence. This is a bearish indicator as we are likely to move lower. (Marked by purple arrows )
Secondly There is a bearish engulfing candle which indicates bearish momentum (Indicated by green arrow), you can find more about the pattern here: www.investopedia.com
Bearishdivergence

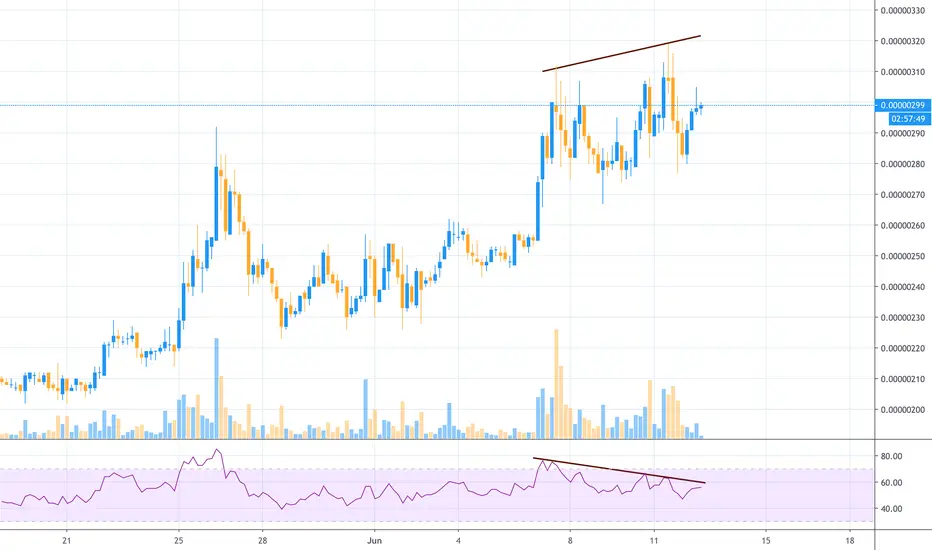
BATBTC | Breakout | S/R Flip | Support Confluence | Trade Setup Todays analysis – BATBTC – Retracing from a multi-month triangle formation breakout (as explored in previous BATBTC analysis - link down below)
Points to consider:
- S/R flip retest
- Support confluence
- 21 EMA visual guide
- Oscillators over-extended
- RSI bearish divergence
- Declining Volume
BATBTC needs to hold the probable S/R flip retest at structural support to establish a higher low, validating a long trade. However, trend continuation at this level will negate the thesis.
Price needs to respect structural support (in confluence with .382 Fibonacci retracement) indicating a probable trend continuation, forming bullish bias in the market.
Trend continuation upon price testing the 21 EMA will support the bullish bias, allowing the EMA to act as a visual guide.
Both the RSI and stochastics cooling off from overbought conditions, a retrace to structural resistance will allow the oscillators to cool off. Furthermore, a technical bearish divergence on the RSI affirms weakness in the immediate market.
An increase in volume will be key as price tests support levels to avoid any false breaks.
Overall, in my opinion, BATUSDT has strong support confluence giving it a greater probability of breaking bullish, however, support re-test is needed for a valid long trade.
What are your thoughts? Let me know in the comments below!
And if you’ve read this far - thank you for following my work and development as a trader!
As always,
Focus on you, and the money will too!

Shill the ZilPlease feel free to comment or challenge me on my TA. If you like my idea, please leave a like to show support.
--------------------------------------------------------------------
Zilliqa has seen a very nice bullrun over the past month. It played out beautifully with retracements whenever it was necessary.
After a 300% increase since the beginning of May it is healthy to see a significant correction come into play. Zilliqa however is a qualitative project with great upside potential. This is why I feel this correction is welcome as it gives us the opportunity to either buy some more ZIL at a cheap price, or to catch a nice trade with high R/R.
What can the chart tell the bulls :
- Elliot wave correction has been fullfilled
- Higher lows have been set (yellow circles)
- Double bottom formation
What can the chart tell the bears :
- Yet to set a higher high
- Bearish divergence with the RSI
- Weekly resistance level at 214 sats
Trade opportunity:
Possible entries: Weekly R (214 sats) or Daily S (206 sats)
Targets: Daily R (229 sats) = 7% and Weekly R (286 sats) = 33%
Happy trading!

Bitcoin ForecastD1 - Bearish divergence.
H4 - Bearish trend pattern followed by double wave correction. Price has broken below the most recent uptrend line.
H1 - Bearish trend pattern, expecting further continuation lower.

Updates for EUR/GBPAt the moment, we see a possible formation of shoulder head shoulder to entry in the sell, so don't closed your position pendent of sell order limit, still active until they active when the market leave at your zone of active into the market. So, I concluded that we are in this formation and we could to see a bearish movement soon!!!
So, this is how in H4 we see a bearish divergence. Now, in the H1 timeframe, if you see the bearish divergence too in this timeframe, it's perfect to operate and put a sell order limit at $0.9064.

Oil Short Term ForecastD1 - Price is currently holding in the psychological level 40, potential bearish divergence.
H4 - We have two false breaks with bearish divergence.
Expecting corrections in the short term.

Z1P : 20% BREAK INCOMING! ZIP CO LIMITED (ASX:Z1P) has bounced back significantly well after the market dump in FEB/MAR, as have all lending services due to the job losses/ government surpluses around the world.
When the market reopens on monday I can see a couple of things happening.
1: WE crack this 'strong equilibrium' as price action continues up the trendline and get squeezed into the corner, 20% TARGET
- Respecting Uptrend
- Buyer Volume Present
-Covid19 crisis still taking a toll on the economy (People still borrowing)
If we do break the equilibrium my next target would be the 4.14 Equilibrium. Careful though as 'Bearish Divergence' could follow.
2: The Resistance holds and we break trend, returning to 'Previous Support' 10% TARGET
-Uptrend Trendline Breaks
-Double Top Confirms
-MACD crosses
-.236 Fib Breaks
3: Previous Support Fails and we fall to 2.84 Support. 15% TARGET
-Breaks .236 & .382 Fibs
-Healthy Retrace after 230% move
-MACD will have crossed
-Center BB will have failed
NOTE: There is an OPEN GAP sitting inside the 'Golden Pocket'. Do not be surprised if we see this fill.
Offering simple interest free and flexible repayment options, Strong Retail Affiliations and having an App in the Top 10 of Google Play and Apple, it's easy to see why Z1P is doing so well. They are up $45Million in revenue and have nearly cracked 2 Million Users.
These Ideas are NOT 'Financial Advice'!. Scenarios are based off a mixture of TA and Fundamentals current at the time. All IMO GLTAH. Happy Hunting!!!

EURGBP short idea, correction, can't make higher highEURO POUND notice the candles with wicks and how they were formed. Also two nice tops near the upper trendline.
Expecting to correct to the nearest key level area.
RSI showing some bearish divergence

EUR/USD present a bearish divergence: Opportunity in shortWell, today I see EUR/USD that show us a bearish divergence in the RSI, so, i conclude to put a sell order limit at very nearest of the price live of the moment. So, we hope of drop of 60 pips approximattely.


#apple - Bearish Divergence - #marketcrash 2.0Rsi has printed huge bearish divergence on weekly timeframe, expecting one more leg down soon

Gold Short Term ForecastD1 - On the daily chart the price respected the resistance zone and is holding below it. Bearish divergence.
H4 - On the H4 chart the price is moving inside a range.
While measuring the first wave we have with the fibonacci expansion tool the 61.8% (1750.62) fibonacci expansion level coincides with the top of the range which makes this area a key resistance zone for us.
Until this key resistance zone holds my short term view remains bearish here.

Bearish Divergence $NVDABearish divergence spotted starting from May 20th. RSI and Volume are decreasing although price is increasing (bearish divergence). Fall through trend line and 325 leads to 295 support

FET/BTC running out of steam?FET/BTC has a strong bearish divergence on the RSI could signal a reversal of the trend.
If you like my ideas and the work I do, please check out the links in the signature ;).
EUR/USD DAILY Chart and Ichimoku Strong Bearish DivergenceThe Euro has been on a short bull run on the stimulus packages announced in the last weeks.
But now has hit a long term trend line and shows a strong bearish divergence on the RSI.
It looks very oversold for a Daily chart on the RSI but also by its distance away from the cloud.
If it breaks the Tenkan ( Yellow line ) It will move fast to test the Kijun ( Dark Blue line ) and if it breaks that the top of the cloud.
Be careful leverage trading is risky so manage your position sizing accordingly!
If you like my ideas and the work I do, please check out the links in the signature ;).

GBPUSD ForecastH4 - Bullish trend pattern, bearish divergence.
The price which is moving higher reached a strong resistance zone formed by the weekly and daily pivot points.
I expect corrective phase now before futher continuation higher.


Oil ForecastD1 - Dark cloud candle pattern, bearish divergence.
H4 - Price has broken below the big and small uptrend line, bearish divergence.
H1 - Bearish trend pattern, expecting further continuation lower after retraces.
Invalidation - This bearish view is valid until the price holds below the 61.8% (39.17) fibonacci retracement zone. If the price moves higher, breaks and holds above this level in one straight leg then this bearish view will be invalidated.

AUDUSD Oversold Bounce| Trading Range| Technical Divergence Evening Traders,
Today’s Analysis – AUDUSD – recovering from weekly oversold conditions, trading in an important range where further price development will allow for a directional bias.
Points to consider,
- Weekly Trading Range
- 21 MA Breached
- Technical Bearish Divergence
- Oversold Bounce
- Extended Stochastics
AUDUSD has entered its macro weekly range from oversold conditions, where it is likely to consolidate and test the range median before another impulse move.
The 21 Moving Average has been breached, the indicator can now act as a visual support guide upon a back test.
AUDUSD has a technical bearish divergence at the range high; this is a sign of weakness in the current market. The oscillators are putting in higher highs whilst the price is establishing a lower high.
The Stochastics is currently overextended; a retest of at least the range median will cool of oscillators.
Overall, in my opinion, AUDUSD is likely to retrace and trade within the range before its next impulse move. The immediate direction is short due to trading at the range high. Further consolidation will help with the directions bias.
What are your thoughts?
Please leave a like and comment,
And remember,
“Intelligence is the ability to observe yourself without judging yourself. In essence, this is mindfulness.” Mindfulness”
― Yvan Byeajee

XAUUSD Short OpportunityHidden Bearish RSI Divergence is present. Indicating a possible bearsish continuation.
Currently trading in a descending channel.

SHORT - ADA - Trading OpportunityA huge bearish divergence has been formed on FTX:ADAPERP , hoping for a run of the stops then a downfall from there, althought we could be shooting ourselves on the foot right here, as ADA has been a non stop machine for the past few months, this is certainly a chance worth taking though, lets get it boys.
Entry: 0.090315
Target 1: 0.084270
Target 2: 0.076960
SL: 0.093845
CryptoCue is not providing investment advice and is not taking subscribers’ personal circumstances into consideration when discussing investments. Investment involves a high degree of risk and should be considered only by persons who can afford to sustain a loss of their entire position.
CryptoCue is not registered, licensed or authorized to provide investment advice and is simply providing an opinion, which is given without any liability or reliance whatsoever. The information contained here is not an offer or solicitation or recommendation or advice to buy, hold, or sell any security. CryptoCue makes no representation as to the completeness, accuracy or timeliness of the material provided and all information and opinions provided by CryptoCue are subject to change without notice and provided on a non-reliance basis and without acceptance of any liability or responsibility whatsoever or howsoever arising. You hereby irrevocably and unconditionally waive, release and discharge: (a) any and all accrued rights and/or benefits you may have against CryptoCue in respect of any opinion expressed or information conveyed by CryptoCue at any time; (b) any and all Claims you may have against CryptoCue arising out of any opinion expressed or information conveyed by CryptoCue at any time; (c) CryptoCue from all and any claims (whether actual or contingent and whether as an employee, office holder or in any other capacity whatsoever) including, without limitation, Claims you may have against CryptoCue arising out of any opinion expressed or information conveyed by CryptoCue at any time. ("Claims" shall include any action, proceeding, claim, demand, judgment or judgment sum of whatsoever nature or howsoever arising.) You hereby agree to indemnify and hold harmless CryptoCue in respect of any and all Losses paid, discharged, sustained or incurred by CryptoCue in the event of bringing any Claim against CryptoCue. (“Losses” shall include any and all liabilities, costs, expenses, damages, fines, impositions or losses (including but not limited to any direct, indirect or consequential losses, loss of profit, loss of earnings , loss of reputation and all interest, penalties and legal costs (calculated on a full indemnity basis) and all other reasonable professional costs and expenses and any associated value-added tax) of whatsoever nature and/or judgment sums (including interest thereon).

AUDNZD ForecastD1 - We had a triple wave to the upside, bearish divergence.
Price bounced from the key resistance zone formed by the 261.8% (1.08610) fibonacci expansion level of the first wave and the 61.8% (1.09576) fibonacci expansion level of the second wave.
Expecting correction to happen now.
H4 - Bearish trend pattern, expecting further continuation lower after retraces.

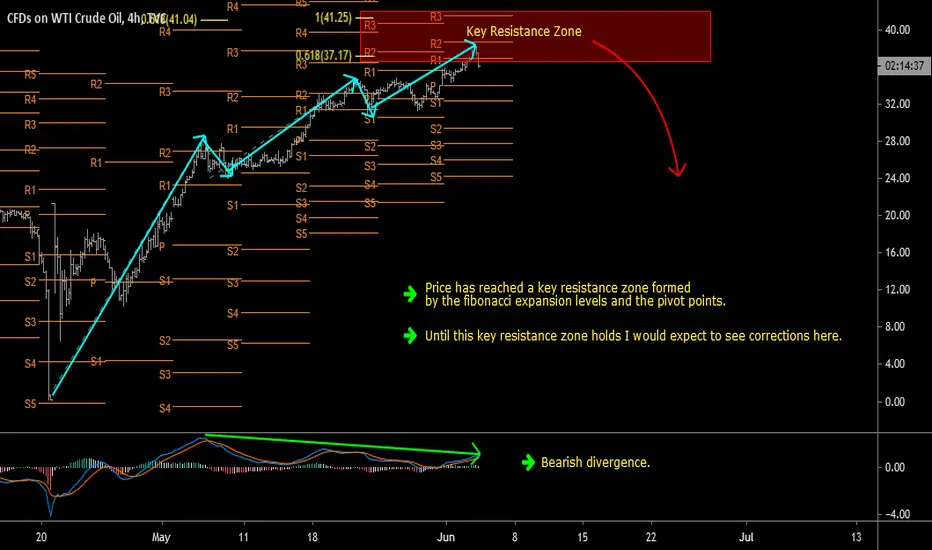
Oil Short Term ForecastH4 - The price which is moving higher has created a triple wave to the upside.
While measuring this triple wave using the fibonacci expansion tool, the 61.8% fibonacci expansion level of the first wave at 41.04, the 61.8% fibonacci expansion level at 37.17, and the 100% fibonacci expansion level at 41.25 of the second wave coincide on the same zone with the daily and weekly pivot points. Which makes this area a key resistance zone for us.
Price has currently reached this key resistance zone. Bearish divergence.
Until this key resistance zone holds I would expect to see corrections here.