Bearish Divergence| S/R Flip Retest| Long Structural Support Evening Traders,
Today’s Analysis – NZDJPY – breaking a key level where an S/R flip will confirm structural support.
Points to consider,
- Impulse bull move (breaking key level)
- Bearish Divergence evident (allowing for a retest)
- Structural Resistance (immediate target)
- RSI putting in lower highs
- Stochastics sell cross
NZDJPY broke resistance with an impulse move, currently trading at its range median with a valid bearish divergence.
A retest of structural support well let the bearish divergence play out – will also confirm the S/R flip retest.
The RSI is putting in lower highs whilst the stochastics is projecting a sell cross – putting more emphasis on the bearish divergence.
Overall, in my opinion, NZDJPY is likely to confirm support with a retest. A long trade will be valid with defined risk below structure.
What are your thoughts?
Please leave a like and comment,
And remember,
“In order to succeed, you first have to be willing to experience failure.”
― Yvan Byeajee
Bearishdivergence


#bitcoin - Three drive reversal H&S idea is still valid, there a gap also on CME that lines up perfectly with our right shoulder, i was short from 9268 but have taken profit here at 100$ move now looking to resort at 9350 targeting 8900 or even lower
also we are printing bearish divergence on hourly still need to see it on 4h
i am also keeping an eye on this cypher that we might be forming
AUDNZD DIVERGENCE SETTINGS! EVENING!!
AUDNZD Divergence in trend! as we are in a down trend TDI stating that price is up when price is down! green line red line crossed!
I am in sells

EURUSD ShortPrice has started to show a bearish divergence
Resistance has been hit and looks as if this has also been rejected.

Is Bitcoin trading in a Micro Inverted H&S?It appears as though Bitcoin is forming an inverted Head & Shoulders inside of a more macro Ascending Triangle.
The RSI is displaying a divergence from the price as well, you can notice there seems to be a sloping line of resistance on the RSI forming a descending triangle pattern.
Bearish divergences signify potential downtrends when prices rally to a new high while the oscillator refuses to reach a new peak. In this situation, bulls are losing their grip on the market, prices are rising only as a result of inertia, and the bears are ready to take control again.

BTCUSD Weather Forecast; a Bearish rainy Memorial Day Weekend On the 4 hr chart, BTC has printed a Bear Flag or (ascending bearish wedge ), and also about to run into the converging 50MA & 200MA. It is testing the bottom of our 2.5 month long, ascending recovery channel, the RSI is showing us Bearish Divergence since about April 30th. We could easily retest 8200 and step down to 7700 & 7300.

Time for a pull back on CRUDE Hello Traders,
Crude oil has enjoyed a great run over the past weeks with minimal pull backs.
Looks like we have just seen a break of a wedge formation with a bearish divergence.
We are look at SHORT positions with a retest of the previous resistance around 30.00
Any thoughts or comments let us know.

SPX Bearish DivsMarket looking weak despite hopium rallies on WH and Fed PR stunts.
Tons of Bearish Div, all the way up, and lots of Stimcheck buyers hodling very overpriced equities right now. Way too high PE and sinking GDP in the US. M2V is at lowest levels, maybe in history, as valuations reach near-bubble stages. Currency washed out by Fed pumping and bidding up prices is through the roof.
What's next?

Oil Short Term ForecastH4 - Price has created triple wave to the upside. Bearish divergence.
Until the key resistance zone shown in the chart holds my short term view remains bearish here.
A valid breakout below the uptrend line shown in the chart would validate this short term bearish view.

NASDAQ Short Term ForecastD1- Price has created a triple wave to the upside.
The price which was moving higher respected the key resistance zone formed by the 9500 psychological level, the 161.8% (9565.6) fibonacci expansion level of the first wave, and the 61.8% (9336.5) fibonacci expansion level of the second wave and is currently moving lower.
We had a bearish divergence and an engulfing candle pattern.
H4 - Price has broken below the uptrend line. Until this uptrend line breakout holds we may expect short term bearish moves towards the key support zone formed by the 38.2% (8327.2) - 50% (8004.2) fibonacci retracement zone of the daily triple wave.

Apple Short Term ForecastD1 - Price is holding below the psychological level 320, continuing bearish divergence.
Price is moving on the upper band of the Bollinger Bands for more than 20 candles.
Note: If you want to learn in detail about Bollinger Bands then check out my blog and youtube channel.
H4 - Triple wave to the upside, the price has reached the key resistance zone formed by the 161.8% (315.29) fibonacci expansion level of the first wave, 100% (325.10) fibonacci expansion level of the second wave, and the psychological level 320. Bearish divergence.
H1 - If we get a valid breakout below the uptrend line shown in the chart, we may then expect further continuation lower in the short term.

GbpJpy bearish ScenarioThe bearish scenario for gbpjpy :
gbpjpy has been pushing up after a big fall....but I don't think it has the strength to continue its bullish movement.
There is bearish divergence since the start of this uptrend and the market is exhausted..it is also at a strong resistance level and from here a fall I very likely
If this zone is not broken then my previous bearish set ups are still valid.

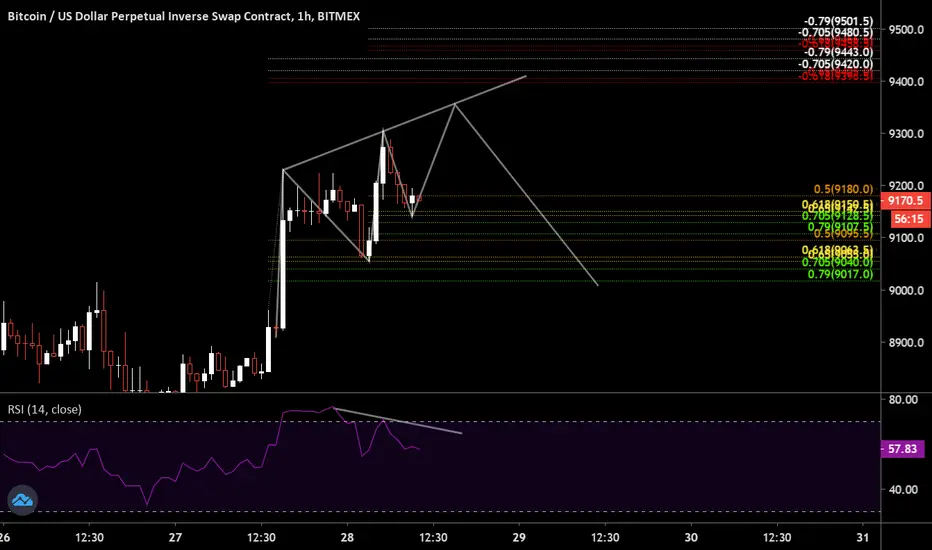
BTCUSD Possible ScenarioLooks to me Bitcoin is forming a classic Bearish Divergence Pattern As of late.
That being said BTC can retest lower support before breaking 9500-9600
I would guard any long position with SL for fund protection.
I am looking to see BTCUSD find strong support before going long.
Until then I am short.
I will post long entrys & SL when time is right and keep updating this setup.

Bearish divergence on GoldMassive divergence is seen no Gold. Likely a pullback soon before the next move up.

Dax Short Term ForecastH4 - Triple cycle to the upside completed, price respected the key resistance zone and is moving lower.
Bearish divergence, the price has broken below the uptrend line.
Price still has room lower towards the key support zone formed by the 38.2% (10010) - 50% (9621.1) fibonacci retracement zones of the triple cycle.
H1 - Price is currently moving inside a bearish flag pattern. We have a key resistance zone formed by the 100% (10675.6), 127% (10737.6), 161.8% (10817.6) fibonacci expansion levels of the first wave, top of the bearish flag pattern and the H4 uptrend line.
Until this key resistance zone holds my short term view remains bearish here.
Break below the bearish flag pattern would validate this short term bearish view.

BTC Double bearish div- Bearish divergence on the past six candes
- Bearish divergence since mid march
- Resistance around $9000 (psychological) or $9112 has been tested once or twice but failed to hold on the daily chart
- Long term view remains bearish (see inset)

Bearish Divergence on 1 HRLooks and feels to me that this current wave has gone too far for too long to be a 3rd of 3rd of 3rd. I tried to figure out a plausible running flat but that doesn't fit either. Still waiting to see. I'll give up on my count and switch to triangle and another high if price breaks 1722.

SP500 ForecastD1 - We have a bearish hidden divergence followed by a potential continuing divergence.
H4 - Bollinger Bands 20 candles ride, bearish divergence.
We have a key resistance zone that has formed by the fibonacci expansion levels of the cycles we have.
Until this key resistance zone shown in the chart holds, we may expect short term retraces.

Critical Area for SPYToday's market action created a "Dark Cloud Cover" candlestick on the close. This is a bearish reversal formation. For confirmation, we would like to see continued bearish movement tomorrow. The close today was right at the rising trendline, perhaps even just below & the market began pulling back near a previous gap down level (dotted pink line). It's important to also note the bearish divergences with the RSI & Accumulation/Distribution indicators as well. Tomorrow may be a big day in deciding which way this market breaks.
If the market continues higher, a move above the gap level of $290.23 will negate the bearish outlook & return to a bullish stance. Be prepared to protect profits on any open positions you may have as none of us knows how far the market can drop on any "pullback" in this current market.

AUDJPY ForecastD1 - Price has reached an important resistance zone, we have a hidden bearish divergence followed by potential continuing divergence.
H4 - We have two key resistance zones that have formed based on the fibonacci expansion levels of the cycles we have.
Price has reached the first key resistance zone, bearish divergence.
H1 - The swing on the H1 chart is approximately at the round psychological 69.00 level.
If we get a valid breakout below uptrend line and the low at 69.02 we may then expect further continuation lower.

MCD - scalp puts to 181.63Broke out of rising wedge on daily chart
Bearish divergence btwn price (higher highs) and MACD (lower highs), with RSI making slight lower highs on the 4H
Broke out of rising wedge with volume on the 1H with MACD crossing down
Bearish divergence again; price (HHs) MACD & RSI with (LHs)
Zooming into the 15M chart, the 8MA has crossed down the 21MA and 50MA, a bearish sign
If $MCD breaks and holds below 184.33 with volume, it could see 181.63.
LMK WHAT YOU GUYS THINK!!! HAPPY TRADING

Trying to Understand My Analysis Mistake for $GRPNGetting frustrated with myself a little bit.
I dumped NASDAQ:GRPN on Monday because I saw these two hidden Bearish Divergences on the dailys.
This was also when it was testing the 50 SMA resistance and I also noticed consolidation on the boiler bands so I assumed that the resistance would hold and price would go down.
For two days now the price has shot up, broken the 50 SMA resistance and broken through the boiler band consolidation. If I held long I could gave gained by now +24% more in profits which I lost out on.
Does anyone see anything wrong with my analysis? I have only been doing this a month.
