USOILIs USOIL exhausting at highs?
As the price is been on high bull run but now it seems like price is lacking bullish momentum after printing double top pattern at resistance level and bearish divergence suggesting the sell pressure is about to start.
If the bears took control , the 1st target could be $86 followed by $85
What you guys think of it ?
Bearishdivergence

EURJPY: Bearish Butterfly with PPO Confirmation and DivergenceEURJPY is trading at the HOP level of a Bearish Butterfly while Bearishly Diverging on the MACD and printing a Bearish PPO Confirmation Circle just a few days ago as it broke the 21-day SMA. If it continues on this path, I'd expect the EURO to lose most if not all of the 2023 gains it's made against the Japanese Yen.

Bitcoin Time to be Cautious with Bearish Signs ShowingHi Guys! This is a Technical Analysis on Bitcoin (BTC) on the 3 Day Timeframe.
We've attempted since April 2023 to try and break ABOVE the Resistance Trend Line
From End of June to Mid July, we attempted to Re-test the Resistance trendline for couple weeks BUT Failed with a REJECTION.
Which brought Price Action to test SUPPORT on the 21 EMA (Purple line), before finally breaking through the 21 EMA and 50 SMA (Green line) with an ENGULFING BEARISH CANDLE.
Bringing us below the 0.786 FIB level.
But pay attention to the Volume, we initially have a spike in VOLUME during the break down but there has not yet been signs of follow through so wtch closely.
2 Major patterns have shown up that makes me CAUTIOUS with BTC atleast for the short term.
If they play out could bring BTC to test the 0.618 FIB level @ $24200
***1st is the fast approaching DEATH CROSS, where the 21 EMA crosses below the 50 SMA.
If you look left ( on your own time) as i have not zoomed out on the chart.
There are MIXED scenarios where some indicate massive bear markets and other times where we have price declines that last only couple months.
I think the later is more likely where we have a correction for some weeks to couple months before having a GOLDEN CROSS and continuing back into a BULL market.
***2nd is the BEARISH DIVERGENCE forming in the charts.
This is when Price action shows HIGHER LOWS but Indicators show LOWER LOWS.
AND that 2 Indicators are showing such signs.
It normally leads PRICE ACTION to mirrow the indicators by also forming a Lower Low.
Thus having the 0.618 FIB level be that LOWER LOW Target.
ALso i would love to see in the Indicators:
1. RSI Move back ABOVE Red Horizontal Line
2. MACD Move back ABOVE 0 level
If we dont, we can see further price DECLINES adding to the risk of seeing that 0.618 FIB Level.
This 2 Bearish Signs merit CAUTION in BTC, i would not take positions here but wait out to see how things play out.
__________________________________________________________________________________
Thank you for taking the time to read my analysis. Hope it helped keep you informed. Please do support my ideas by boosting, following me and commenting. Thanks again.
Stay tuned for more updates on BTC in the near future.
If you have any questions, do reach out. Thank you again.
DISCLAIMER: This is not financial advice, i am not a financial advisor. The thoughts expressed in the posts are my opinion and for educational purposes. Do not use my ideas for the basis of your trading strategy, make sure to work out your own strategy and when trading always spend majority of your time on risk management strategy

Bearish divergence for EUR/JPYEURONEXT:EUR / $JPY has started the year at the yearly pivot point. After 9 months, it is flying around the second yearly resistance. The price has started to stall at the monthly resistance point and RSI shows bearish divergence. If we break this resistance, I don't expect the price to break the second yearly pivotal point.
Disclaimer – WhaleGambit. Please be reminded – you alone are responsible for your trading – both gains and losses. There is a very high degree of risk involved in trading. The technical analysis , like all indicators, strategies, columns, articles and other features accessible on/though this site is for informational purposes only and should not be construed as investment advice by you. Your use of the technical analysis , as would also your use of all mentioned indicators, strategies, columns, articles and all other features, is entirely at your own risk and it is your sole responsibility to evaluate the accuracy, completeness and usefulness (including suitability) of the information. You should assess the risk of any trade with your financial adviser and make your own independent decision(s) regarding any tradable products which may be the subject matter of the technical analysis or any of the said indicators, strategies, columns, articles and all other features.

Gold to Repeat the 80s by Undoing 20+ Years of Price ActionGold seems to be on track to completing a fractal of the mid 70s to Late 90s where it resets over 20 years of Price of Bullish Price action by way of losing over 70% of its value after a previous inflation fueled rally. Now we can see that we have the 20 Year Trend Line, A bearish Alt Bat, Bearish PPO Confirmation, and Bearish Divergence all as we head back towards trend where we will likely break and begin what will probably a long and slow decline down until we reach the 20-30 year lows at around $253.
This is basically a followup to my last 2 macro gold charts that I will provide in the related idea section below.

CAH: Bearish Crab with PPO Confirmation on the WeeklyCardinal Health has traded up to a Macro Supply Line which happened to align with the BAMM Target of a Bearish Crab and from there we formed MACD Bearish Divergence and got the strongest form of PPO Confirmation, as a result I now expect that we will begin a very deep retracement back down similarly to how Strongly CVS has responded to its own topping pattern which can be seen in the Idea Below:

EURNZDIs EURNZD exhausting at highs?
As the price is been on high bull run but now it seems like price is lacking bullish momentum and bearish divergence suggesting the sell pressure is about to start.
What you guys think of it ?

Quick Look - Bullish Divergence vs Bearish DivergenceHere is a graphical representation of the simple concept of bullish and bearish divergences.
Rules are pretty clear
Bearish Divergence
Happens only in uptrend
Observed on pivot Highs
Price makes higher high whereas oscillator makes lower high, indicating weakness and possible reversal
Bullish Divergence
Happens only in downtrend
Observed on pivot Lows
Price makes lower low whereas oscillator makes higher low, indicating weakness and possible reversal
Watch out for hidden divergences on the opposite pivots and breakouts in the direction of trend.

USOILUSOIL is been on enormous bull run. And now reached to daily resistance zone.
In past bears took benefits from this level multiple time and turn the trajectory of commodity.
Like in past , this time it is also looks like bears were waiting for this level again, as it can be seen from the chart that bullish momentum being fade out.
more ever bearish divergence also suggesting a control of bears is starting now.

BTCUSDT next demand zone aheadThe current price action is aiming the next demand zone as shown on this 30m chart. That impulse bearish movement, as expected, based on Elliot Principle, is about to happen. Bearish divergence on Chaikin Money Flow.

EQIX: A way to Short AI & Commercial Real Estate in One StockThis company deals with renting out Commercial Real Estate, mostly to do with Datacenters and other Internet Connected Operations, and due to that, this makes it a perfect stock to get Bearish Exposure to if you are both Bearish on the AI Big Tech Mania and Bearish on Commercial REITs
One of the main risks for this stock is if their biggest clients, like MSFT and AMZN begin to shift away from using Equinix datacenters in favor of creating and using their own in order to save on costs. If MSFT's recent earnings call is anything to go off of, they are currently desperate to increase profit margins and reduce the costs associated with their business operations especially the costs associated with working with third parties.
One area in which they could cut costs would be to reduce their reliance on Equinix datacenters, but in general as the AI Mania begins to wind down we could likely see the Equinix enterprise consumer base shrink even more, in which case we could see price begin to correct to reflect upon their lower cashflows as both the AI and Commercial REITs sectors continue to slow.
Beyond that: We have a Bearish Shark with MACD and PPO Bearish Divergence and PPO Arrow Confirmation; with hardly any support below us. If it plays out we could see a decline of about 50% from the current price level.

BARUSDTRecently BARUSDT has shown good bullish momentum but failed to sustain it and formed double top pattern with bearish divergence and now showing sell pressure. Will the bears attack on these confluences and direct the price to downside?

UK100UK100 is trading at strong supply zone and also created very strong bearish divergence, these confluences putting sell pressure on uk100. as the inclining trendline also waiting for 3rd pivot to trendline. Will UK100 decline to support area ?

BA after earnings pop. Will it drop?Boeing had a big pop from very favorable earnings today. So far there has
not been a fade or retracement. The relative strength lines however topped
out and then retreated a bit signaling bearish divergence with the lower TF
below the higher black TF line. Likewise,
the MACD indicator is showing a line cross above the histogram whose
amplitude has dropped to zero then changed to red / negative.
Lastly, the mass index indicator shows a rise above the reversal zone
then with a trigger signal in dropping below the zone.
I conclude that BA over-extended and is now setup for a short trade which
could be either stocks or a put option. For the stock the stop loss is 232
the swing high and the target is 223.25 at the mean VWAP line. If price can
cross under that line, the target for the remaining runners will be 217 just
above a lower VWAP line. I will buy the strike $225 expiring 8/4 to potentially
exploit this expected quick retracement.

Strong bear divs on CHDLast two tops were $98.33 and $100.52, however the last top was on lesser volume. Which has printed an obvious bearish divergence. Since the last high ($100.52), the stock has continued to decline and volume has continued to drop - printing more obvious bearish divergences.
This is a clear short, I guess the earnings report will be a trigger for further decline in the price of this stock.

MSFT: Bearish Crab with Double MACD Bearish DivergenceMicrosoft has traded up to a 1.618 Fibonacci Extension and has formed a Bearish Crab with Double MACD Bearish Divergence, so long as $350 holds as resistance, I think it could go as low as about $295 to fill the gap below.
In the meantime, I have sold $350 multi-week calls.

ASML: Bearish Cypher Trend Break Down ConfirmationASML has broken below a trend line and confirmed it with a secondary weaker test and during this test we formed a Bearish Abandoned Baby, some MACD Bearish Divergence, and printed a Bearish PPO Volatility Circle. With all this confirmation at the potential Cypher PCZ, I'd say we have a pretty good chance of this Cypher playing out instead of the deeper .886/1.13 Shark.

UNIUSDT Bearish Divergence 1H and 4H🚨📉 Alert to Crypto Traders 📉🚨
📈 #UNIUSDT #BullishTrend #BearishDivergence 📉
Crypto community, pay attention to UNIUSDT! 🚀📉
📈 The overall trend for UNIUSDT in the 1-hour and 4-hour time frames remains BULLISH, forming Higher Highs (HH) and Higher Lows (HL). 📈📈📈
🚨 However, we've spotted a concerning sign: #BearishDivergence on the Momentum Indicator RSI. 📉 RSI is showing Lower Highs (LH) and Lower Lows (LL) despite the price making higher moves. 📉📉
📉 This bearish divergence can be an early warning signal of a potential trend reversal or correction. 🛑🔄
📝 Trade Recommendation:
📌 Keep a close eye on UNIUSDT's price action and RSI movements.
📌 Consider tightening stop-loss levels or reducing position sizes to manage risk effectively.
📌 Exercise caution when opening new long positions, as the bearish divergence could lead to a pullback.
📊 Remember, successful trading involves understanding both bullish and bearish signals to make informed decisions. 🧠💡
🛡️ Trade responsibly and stay updated with market trends! 🚀📉
#CryptoTrading #TechnicalAnalysis #RSIDivergence #TradeSmart #RiskManagement #MarketAnalysis
Disclaimer: This analysis is for informational purposes only and not financial advice. Cryptocurrency trading carries risks, and past performance does not guarantee future results. Always do your research and consult with a professional financial advisor before making trading decisions.

AUDUSD: Double Top with Bearish Divergence on the DailyThere is some Bearish Divergence visible on the Daily as the AUD comes out of the overbought zone for the second time. I think we could eventually see it come back down to the hard support floor at 62 cents.

EURJPY Short Term Sell IdeaH1 - Bearish trend pattern.
Currently it looks like a pullback is happening.
Bearish divergence.
Until the two key resistance zones hold my short term view remains bearish here.

AUDCADAUDCAD has formed double top with strong bearish divergence. Which is potential reversal pattern. Will these confluences put the pair in sell pressure.?

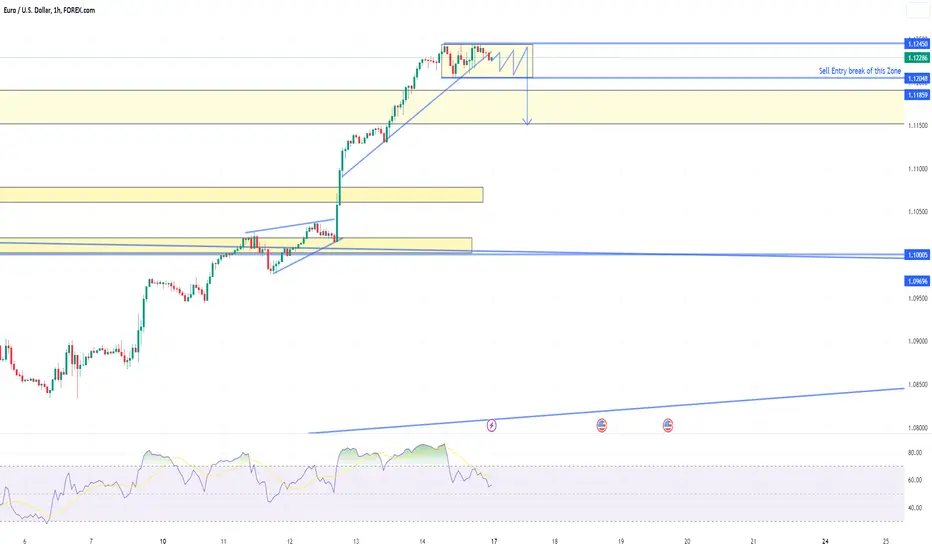
EUR USD Bearish Divergence 1 hr FOREXCOM:EURUSD EUR USD continue up more then 7 days now take some rest of this Zone.
Bearish Divergence is Mature in 1 hr and 4 Hr TF. Now wait for Break of H.L Then Enter short sell Entry
Profit Target 50 to 80 Pips
Bitcoin in MAJOR Trouble?Recently I posted an idea about bitcoin breaking out and running to much higher prices and shortly after, the number 1 cryptocurrency asset attempted to take the first step to doing so. However, there was no follow-through in price action and now Bitcoin finds itself in a very vulnerable position. It is still very bullish in my opinion and I do believe more price action to the upside is coming, but right now Bitcoin has painted several bearish signals on its chart that must be discussed.
One of them being a bearish reversal candle on the daily chart. More specifically referred to as a bearish engulfing candle. They form at areas of resistance and are often validation of weakness in price action such as bearish divergences for one example. There are other bearish reversal candles as well.. this is just one of them.
We also have major weakness in relative strength as we have now confirmed triple bearish divergence on the daily RSI. There is also a strong case for bearish divergence on the weekly timeframe as well. For now it is expected for us to remain in the trend but with all of this major weakness in the market, follow through sell pressure could come at any moment. We are now heading into the weekend, so the price action over the next few days will be unreliable. This could be a good thing as this may give unsure traders time to adjust or hedge their positions.
If and when that breakdown occurs, there are levels of interest that we will discuss. But for now as we head into the weekend, we must simply wait until institutional markets open back up on Sunday evening.
