MANA MANA is progressing in side an big descending channel. For now we see a bearish flag with two strong resistance and ichimoku cloud is also acting as resistance.
Buy @ 2.2 - 2.25
TP1: 2
TP2: 1.8
TP3: 1.7
TP4: 1.6
TP5: 1.22
STOPLOSS: 2.3
Bearish Flag

NEW BEAR MARKET!!!This is my idea for Bitcoin for the upcoming months. Bitcoin will first visit 50k, the top of the rising wedge / bear flag . After the 50k BTC will fall because of the macro economic circumstances. Posted it few days ago but it was banned so again.

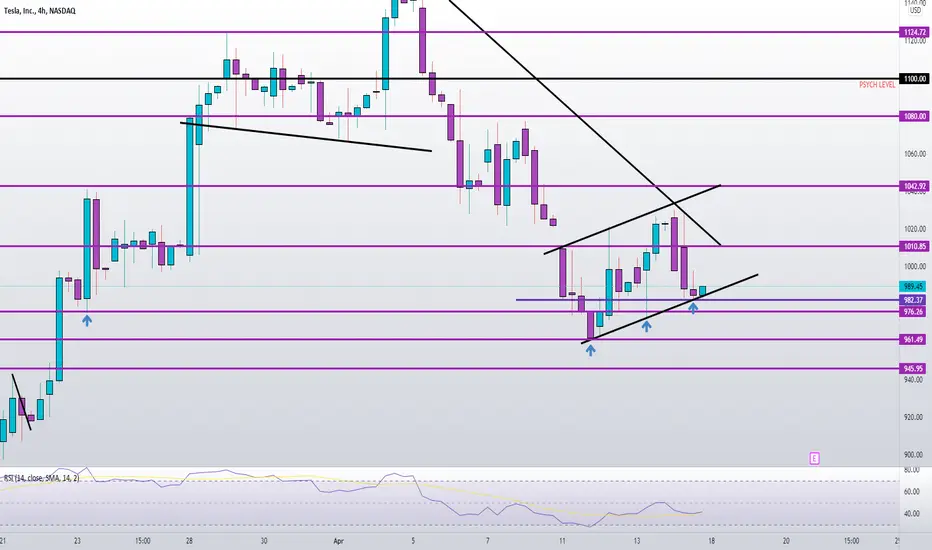
TSLA possible bear flag?Possible bear flag?
Trigger could below 982.37 with targets at 976.26 , 961.49 and 945.95
GBPUSD-Weekly Market Analysis-Apr22,Wk3GBPUSD has a bearish trend on its higher timeframe. On the 1hourly chart, I'm waiting for the market to touch the bottom of the rectangle and bounce back to the top.
At that price, I will wait for a shorting opportunity for a Bearish Flag Pattern trading opportunity. This formation will be stronger than the market breakdown of this sell zone.

EURGBG - Short StrategyAccording to chart analysis, We can see a Bearish Trend is in place and I support that a Bearish Flag can be witnessed, by taking into consideration of Support & Resistance.
Trading Plan: Short
Entry: 0.82767 Current
SL: 0.83033
TP: 0.82122

BTCUSDon weekly time frame, I am still considering we are on bearish trendline - major trendline support - broken back to the week on 17th of January, BTC still struggling to got back above this trendline 47.5 / 48.5k area with confirmed candle closed above. Also looks like perfect example of BEAR FLAG forming recently. Looking also from combination of Elliot waves patent (1/2/3/4/5 - bullish back to MARCH 2020 till MARCH 2021) then ABC correction / potentially final leg down to complete C wave.


BTC SHORT SET UPMarket just finished 1 to 5 Elliot Wave Theory and formed a bearish flag pattern at the bottom, broke it at the bottom so we are expecting price to continue dropping until it reaches demand zone at 30000 zone.
Target:30200
Entry: 37729
Invalidation: 40571

LTC*USDT Possible bearish flag in 4h tfTaking in to account the current situation of BTC that in my opinion made a weak bounce from support of 39k like you can see in my other analysis i expect it to touch the 37,5k level and then we will see if it holds.
Meanwhile i see this a probably good trade.
Because of:
-Touching resistance
-Touching upper line of ascending
-Weak state of BTC
----------------------------------------------------------------
Target and stop in chart
This in only my opinion, is not a financial advice, never risk your capital before making your own research and having a good risk management.
I would be pleased to see what do you think in the comments.
Regards and happy trading neither fear nor hope.

Bearish flag !!!Simple flag, simple trade
PT1 seems very possible however I don't think PT3 is realistic. I would say max pain would be PT2.
Pure technical - Not fundamental

Bearish flag in BTCUSDTI usually don't share my ideas but in this case, I had to warn you. a perfect bear flag and a perfect s/r level(20-24k) for capitulation event .
We see little liquidations lately and volume is still low compared to 2020-2021.
About on-chain, everything on-chain is bullish(long-term) except Estimated Leverage Ratio which is currently at it's ATH increasing chance of big dump (short-term).
The best way to find a bottom is volume(big big liquidation, maybe more than 2-3Bilions).
This is only my personal opinion and YOU MUST NOT OPEN ANY POSITION BASED ON THIS IDEA .
be safe and DYOR.

BTC/USD: Bearish flag channelAt the moment in this analysis, Bitcoin forming this bearish flag pattern in H1 timeframe. But Bitcoin it's appear that have issue to break up the EMA 200 around $43,400 USD. And that what Bitcoin show now it's signal that bears are taking control in Bitcoin price. I put a short in the price around $42,647 USD and SL to $43,600 USD and target to $41,000 USD.
I'm shorting Bitcoin now. I see that Bitcoin make the movement and cryptocurrencies depending 100% what Bitcoin do.
So guys, the previously analysis of Bitcoin about butterfly harmonic pattern will be cancelled as I check out in H1 and I have this perspective that we're going to short Bitcoin.

DAX Week ahead. High probability!!!Hello Traders
Here is an idea to trade the German Index next week.
Last Wednesday we saw a break through the neckline. If someone missed this chance to go short, there will be another two chances next week. One at the resistance between 14300 & 14330 and the second at 14200. TP is at 13700 - 13750.
Good Trades!!!

BTC chart a bear flog OR an uptrend ?Hello lovely people
As you can see BTC chart is about to tell us if it's a bear flag which can take price down at least to 37,000 USD or even worse.
However in other hand it can be a beautiful uptrend channel which is good for me (I mean, who doesn't feel that way) and this can take price up to maybe new ATH like 80,000 USD in a month or two .
That was just an apparent thing I saw in chart and made an idea for it.
Hope you enjoy this one and be more careful in opening new positions.
Use stop loss everywhere and be safe :)

Ethereum Bear Flag Forming - Next Target for ETH?Hello Traders
Here is my analysis for Ethereum...
ETH is forming a Bear Flag. Right now it is still technically immature, however if it continues to follow the channel it has been trending between then soon enough a mature Bear Flag will form and the probability of a break to the downside greatly increases.
What is the next target for ETH?
- If the formation plays out like I think it will, ETH will hit $3,000 in the next week, maybe even days.
- $3K is a major level for ETH. It is not only a major support level with multiple strong touches, but it also coincides perfectly with the .5 Fib.
- Another factor (Although not as powerful) is that the bottom trend line ETH has been following for the past 10 days leads straight to the $3K level.
*There is enough confluence here to rate this target as a high probability of being hit.
What will happen when ETH hits the $3K level?
- I would expect a strong bounce.
I will make another post with a trade idea for a long position in the coming days.
Happy trading and best of luck.

The next expected scenarios for Bitcoin |🐻vs🐂BTC is currently facing a lot of pressure especially after losing his it's strength. we already went down so bad but what could happen in the next meantime?
⬇️
We are currently in a bear flag => $BTC is bearish in mid term where 30k levels are very possible.
We are also on a Trendline & The middle of the Bear Flag channel => This could be a strong point for $BTC to gain it's strength for the final pump. If it pumps, we will see a Bull flag, taking it's price to the 50k levels.
But what happens if we don't reverse? Sadly, we might visit the low levels again( starting from 41 - 40k down to 37k levels ) . Bellow the 37k levels will be the confirmation of the bear flag $BTC , we will see many bearish months and levels.

Bitcoin Short Entry - Bearish Pennant Formed - Next Move?Here is my chart analysis for BTC/USD.
There are quite a few things to cover here both in the short and longer term.
Short Term:
-BTC has formed a Bearish Pennant with perfect structure. The technical target is around $41,300.
-You could enter a short from the pennant using an entry method if breakdown occurs and bearish continuation is confirmed.
Longer Term
-Imo BTC is currently trending bearish and will continue lower over the coming days/ weeks.
-Until BTC breaks the channel trend line and 200 MA I am Bearish. Plus on the Daily chart BTC has formed an ascending channel since January. An ascending formation like this is Bearish which is why I believe BTC will inevitably retest the lows.
-It's possible that in the short term BTC gets a bounce off this level and gives another try at breaking the $48k major level.
-However, inevitably I do believe that BTC will head lower and retest the bottom trend line lows at around $40k, then $36k and possibly lower.
-So if you are Bearish now is the time to start planning your shorts if you haven't already entered one.
-I currently have a short open with the entry price of $46,400. I will either re-accumulate if BTC heads higher or will sell at the $40k support level if BTC trends down.
Happy Trading and Good Luck!
*This is not financial advice and I am not a professional.

EURUSD BEARISH FLAG BREAKOUTMarket moving down formed a bearish flag and just broke out, we are looking for a candle to close below the pattern and that should be our sign to entry.
Entry: 10.094 (Now or when candle closes below flag pattern)
Invalidation 1.09904 (above recent LH)
Target: 1.07343 (Strong institutional zone)

GMT Bearish Flag Pattern before new ATHIt seems we have here a Bearish Flag Pattern. Once we break the upper channel line we will see another pump of GMT and after some fluctuations we can reach a new ATH.
-----------------------------------------------------------------------------------------------------------------
Please note that this is not a financial advice. Just my personal idea. Do your own research.

USD/JPY: Bearish divergence formedIn this analysis, U.S. Dollar/Yen Japanese forming a bearish divergence in 30 minutes timeframe. Also, we see a bearish channel flag pattern and we see a broke down of this chartist pattern in USD/JPY. As I see a bearish setup, this could be an amazing profit of 122 pips approximately to find down.
Now, I want to share here another timeframes what I found out.
In H4 timeframe, I see the same in 30 minutes timeframe, but this it's very different because in H4 we forming a key supply zone in that gray zone that it's called imbalance zone and we see that this could be another signal that we're going to short U.S. Dollar in front of Yen Japanese.
And also, to know more deep, we see a bearish Gartley harmonic pattern with all Fibonacci measure to valid this harmonic pattern, with Fibonacci measure and also, the confirmation of this bearish divergence and break out of this bearish channel flag pattern in 30 minutes, all thesm it's a good signal to short U.S. Dollar.
So guys, I see that this trade has a lot potential to find a short position. For that, I put a place a sell order limit a little more of the price at 122.66 JPY and SL to $123.15 JPY (49 pips) and target to $121.44 JPY (122 pips). This have a risk/benefit 1:2.
I hope that this idea support you very well in this Forex weekly.

🐻USD/CHF SHORTOn the daily chart, USD/CHF has been in a range for some time. This range can be recognized as a bearish continuation, as it has formed after a bearish impulse.
When price tested the resisting trendline for the third time, we saw strong rejections indicating selling pressure.
Price has now been moving in a corrective manner downwards, this signifies a reversal but in this case it most likely be a retracement.
At the 61.8% retracement, the is a strong area of resistance.
If price retraces there, it would form a perfect head and shoulders, which is what i expect from this pair.
The right shoulder is normally lower that the left one so price may reject the 50% retracement then push downwards.
Remember that the market may just take off where it is, in such a case, look for entries at the breakout of the trendline.
Targets are set in green.
OANDA:USDCHF

🐻EUR/USD SHORTEUR/USD has been bearish for months now.
Price broke out of recently created support on the daily chart which is around 1.118 a while ago.
Price, moving in a corrective manner, has retested this previous support and has used it as a resistance as we saw strong rejections.
Price has also formed a bearish continuation pattern.
We should look to enter on any retracement or on the trendline breakout and retest.
Targets should be set at the level marked in green.
OANDA:EURUSD

XAU / USD 1948.13 - 0.83 % SHORT IDEA * CONTINUATION & PTTNSHEY EVERYONE
HOPE EVERYONE IS DOING GOOD HAVING A GOOD ONE,
AN IDEA ON THE GOLD METAL THIS WEEK.
* The metal has been Correcting for a couple of weeks now, seems we have entered some slowing down in momentum with the bears as we ranged in a Bear flag possibly signaling continuation.
- Short term the METAL has currently Rallied with a down trend as WE broke below on the 4h chart. hitting ( LH , LL ), looking for a continuation of this trend with the bears.
- Looking for SHORT entries on the METAL this week should all the rules of the formation be met, A break above of the marked structure and close CANCELS the trade should the bear flag / ascending channel come into play again could be just a delay to retest another resistance just above there.
SCALLING DOWN
lets see how it goes
IF THIS IDEA ASSISTS IN ANY OR IF YOU LIKE THIS ONE
SMASH THAT LIKE BUTTON & LEAVE A COMMENT.
ALWAYS APPRECIATED
____________________________________________________________________________________________________________________
* Kindly follow your entry rules on entries & stops. |* Some of The idea's may be predictive yet are not financial advice or signals. | *Trading plans can change at anytime reactive to the market. | * Many stars must align with the plan before executing the trade, kindly follow your rules & RISK MANAGEMENT.
_____________________________________________________________________________________________________________________
| * ENTRY & SL -KINDLY FOLLOW YOUR RULES | * RISK-MANAGEMENT | *PERIOD - SWING TRADE
