EURUSD WedgeThere is a wedge formation on the 4h and 1h on EURUSD. I will not predict which way it will breakout, as I am a reactionary trader and neither I nor anyone can predict the future. However if it breaks under or above support/resistance AND closes, then I will execute a trade in that direction until it reaches the next support/resistance.
DO YOUR OWN ANALYSIS, DO NOT EXECUTE A TRADE JUST BECAUSE A STRANGER ON THE INTERNET HAS A COMPELLING ANALYSIS>
HAPPY TRADING AND BE CAREFUL :)
Thanks,
Richard Blake
Bearish Flag
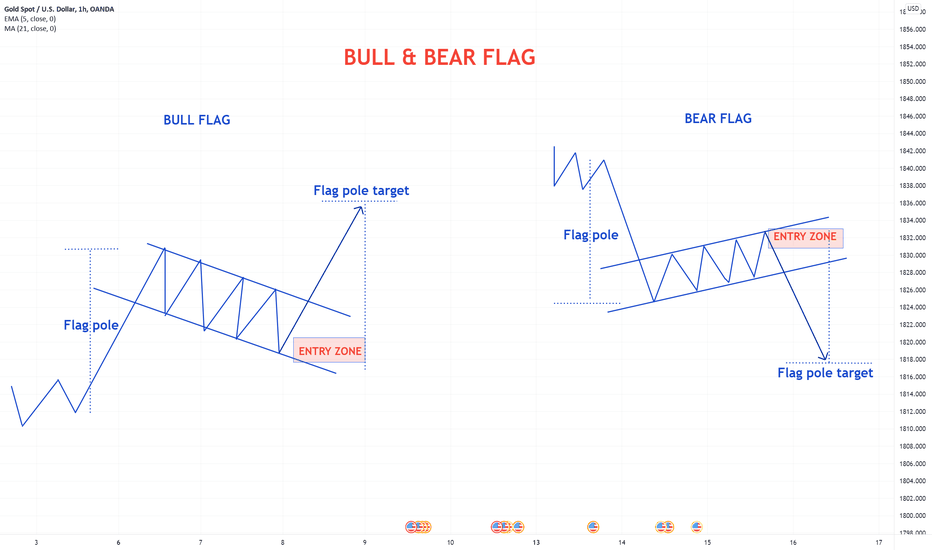
BULL & BEAR FLAG PATTERNSBULL FLAG
This pattern occurs in an uptrend to confirm further movement up. The continuation of the movement up can be measured by the size of the of pole.
BEAR FLAG
This pattern occurs in a downtrend to confirm further movement down. The continuation of the movement down can be measured by the size of the pole.
Please don't forget to like, comment and follow to support us,
GoldViewFx
XAUUSD TOP AUTHOR
Bitcoin's current price action (December 2021) bear flag?Hello all,
The uptrend from July got destroyed with a $16,000 crash before stopping at $42,000. The uptrend which triggered the bull market that started March 2020 hasn't been tapped since the 2nd validation touch in October of 2020. It's been over a year now....be ready for anything.
If we see a rejection from the retest of the broken uptrend it's likely we go much lower which would result in painting a bear flag leading to deviation of Septembers low for liquidity purposes.
(not financial advice, this is my journal)
BTC/USD ABC Correction in PlayLikely BTC/USD ABC correction in play.
Notice the confluence of extensions and key levels. If compared to the 4 hour downtrend line (in white), a bounce to 56k would still make a daily downtrend valid.
Meanwhile the recent bounce off of $47.1K could be a potential support but the more likely scenario is a bear flag and an ABC dead cat bounce.
Zooming out to the weekly we see fractal patterns resembling a bear flag with further downside in play. Volume candles on the recent capitulation dump prove notable but not convincing. The recent break below the orange trend line shows a potential bull trap fake out last week followed by a Friday night massacre on the markets.
Useful is a comparison the the ETH/USD and ETH/BTC charts when compared with ETH.D dominance which recently peaked at 22%.
🔥 SHIBA Bear Flag: Volatility ExpectedSince yesterday's massive sell-off, SHIBA has been following a clear triangular pattern, also known as a flag. Since the pattern appears during a bearish trend, it's a bear flag.
Consolidation patterns, like this flag pattern, often result in a volatile move once the pattern is complete. Since this is a bearish continuation pattern, statistically a bearish break out would be more likely.
However, the current dip is being bought up very quickly, so I wouldn't be surprised if SHIBA made a bullish move withing the next couple of hours.
In case of a bullish break out, wait for the price to close above the yellow dotted line before entering. Same goes for bearish, but on the other side of the pattern.
Targets placed at recent local tops and bottoms.
Happy trading!
Vecahin forming a bearish flag!Here is my TA for Vechain , from my perspective there are two good trade opportunities. One being long to hit 0.20 and finish creating it's bearish flag formation and then a short at 0.20 falling to a strong recent support level being at around 0.5800.
I recently bought in at 0.11000 and I'm hoping to exit my trade and start a short at 0.20.
I would really appreciate any feed back and opinions. Many thanks.
GBP / JPY 151240 -0.09 % SHORT IDEA * TREND CONTINUATIONHELLO EVERYONE
HOPE EVERYONE IS DOING GOOD HAVING A GOOD ONE, HERE'S A LOOK AT POSSIBLE SCENARIOS THAT COULD PLAY OUT IN THE COMING WEEK ON THE POUND / YEN.
-The pair is trading in that descending channel with significant momentum towards the downside.
- Upon open today we've been in the formation of a bear-flag possibly signalling continuation.
- Targeting both the FIB EXT on the pair should we rally down to break below on this one.
here's where we where in the past week.
* looking for trend continuation on this pair.
IF THIS IDEA ASSISTS IN ANY OR IF YOU LIKE THIS ONE
SMASH THAT LIKE BUTTON & LEAVE A COMMENT.
ALWAYS APPRECIATED
____________________________________________________________________________________________________________________
* Kindly follow your entry rules on entries & stops. |* Some of The idea's may be predictive yet are not financial advice or signals. | *Trading plans can change at anytime reactive to the market. | * Many stars must align with the plan before executing the trade, kindly follow your rules & RISK MANAGEMENT.
_____________________________________________________________________________________________________________________
| * ENTRY & SL -KINDLY FOLLOW YOUR RULES | * RISK-MANAGEMENT | *PERIOD - SWING TRADE
BTC - Bear Flag Break Back-TestThe Back-Test, a position of courage and risk/reward. The commitment to take the quick stop is my main focus when utilizing the play. A R/R of 2/1 allows for 50% winning rate. BTC has broken the Bear Flag with a wick and now needs to see volume and a reversal pattern to form for a play to upside. For additional downside the play is more apparent as the lower bound of the Bear Flag has formed.
trade ideas for GBPUSDHellooo...My Dragon Friends...
Just Update,
Market GBPUSD, have potencial make SHS (on proses formed).
and already break di trendline, and still have bearish flag (in a big trend, still valid).
so we try make sell GBPUSD.
GBPUSD (Sell GBP to USD)
Target Sell GBP at Now (1.3440) or (1.3440-75)
SL at 1.3525
TP 1 at 1.3355 & TP 2 at 1.3325 & TP3 at 1.3265
Lets See...Happy Trading
Disclaimer On


