BTC 1H OutlookWould need further consolidation for another high break to be potentially profitable and carry momentum behind it. For now, we remain in a bearish flag.
Bearish Flag

Update #2 The crash continue !After many great prediction i continue to believe that btc is going to 23k . I have predicted the rising wedge the falling wedge and then the bull trap so i hope it's enough to show that i know what i'm doing
Note : ive also predicted the last 3 crash from BTC

AUDUSD - SELLWe have nice impulse and correction like a flag. If today this bar close like bearish engulfing from 50% Fibonacci level I will place Pending order below the flag.
If this happend expect for long term to go down to 0.70350
Good luck!

Bearish Flag on XAG/USD @ D1You can see a bearish flag on the XAG/USD (Silver) daily chart. It offers a downside breakout trading setup. The flag and its pole are shown with the yellow lines. My potential take-profit level is marked with the green line. My potential stop-loss level is marked with the red line. It is best to wait for a close reasonably below the lower border of the flag area to initiate a sell trade.

All-in Short 🔻 Double: RSI Resistance, Channel ResistanceAll-in Short 🔻 Double: RSI Resistance, Channel Resistance
🔴 KEY POINTS:
- RSI is strongly overbought
- Momentum hit RSI Resistance
- Price Action hit Channel Resistance
- Machine Learning (Artificial Intelligence, Linear Regression) says upcoming Resistance
- Chart Pattern: This Technical Indicator Variation worked 100% in the past
We've opened short. All-in.

XAUUSD, 4hr tf, bearish scenario
Possible scenario for XAUUSD.
Price going up inside this channel and the recent drops on Friday confirm a break below the support.
It looks like XAUUSD making a bearish flag or possible rising wedge. If it plays out as bearish flag, the drop on XAUUSD gonna be massive.
This upwards movement is a retest of broken trendline.
We could see XAUUSD continue decline further.
Sell XAUUSD 1815
Stop loss 1825
Take profit 1750 (6.5R)
Use only 1-2% risk
Good luck

BNBUSDTBEARISH FLAG PRICE ACTION
This chart pattern starts forming with bears already in control of the exchange rate's sharp downtrend. When bulls enter the market, trading is contained briefly in an up-sloped range. Bears then break that range's lower resistance, and the exchange rate continues its downtrend.
Let's break down the pattern formation!
A sharp downwards price action is initiated from (1) till it finds the first resistance (2), creating the flag's pole.
Price action reverses direction from the first resistance (2) and starts forming higher lows and higher highs in a narrow flag-like formation, till it finds the highest support in that formation at point (3)
The pattern is completed when price action reverses direction from the highest support (3) and goes downwards till it breaks the flag's lower border at point (4)
Entry: after breaking the flag's lower border at point (4)
Take profit: identified by measuring the flag's pole height, which is the vertical distance between points (1) and (2), that measurement is then applied from the breakout rate (4)
Stop loss: the flag's highest high (3)


Bitcoin simple but powerful analysis with bullish bearish levelsBitcoin simple but powerful analysis with bullish bearish levels
Dear friends,
A different and very simple look at Bitcoin with the different bullish and bearish levels. Also posted so that you can follow it with the button in te screen to update the chart.
This can be short but powerful. The simpler the better! Please note that my previous analyses are just still valid including the levels. This is just another simple view of Bitcoin, the other posts show the patterns etc.
Above the green horizontal trend line there is a bullish scenario, below the orange trend line at 28805 a clear bear market with much lower levels. Above 35146 we have a higher high and below 32000 a lower low.
We have the following bearish patterns (see it in my other posts)
1. 3X HS formaties
2 a larger bearflag
3. A series of lower highs and lower lows.
4 The red trendline connecting the lows which is extremely important was broken .
5. Once again declining volume with rising price
Note how during the decline the volume went up and during the last rise the volume went down. When you see something like that it is normally just bearish.
A rise without volume will collapse under the force of gravity.
Also take into account sudden interventions of whales and large funds. That is the only thing that can disturb the TA on the smaller timeframes.
It now strongly looks like we are going to test the low again and maybe even drop below it. However, it is far too early now to judge that. The market is dynamic and anything can change. Therefore, step by step. No long term predictions that will be of little or no use to you at this time. After all, you want to make a profit now. It's good to have the fundamentals in your mind but it is important that it immediately not affect your trading from charts. If so, you won't be able to go on trading because of the many contradictions.
As an advice, do not risk more than max 2% of your capital on the whole of your trades. The Crypto market moves together so 4 positions of 0.5 % risk is already the max of 2%! Of course many will not keep these numbers but is is a fact that without this you have a much higher chance of getting a zero account. The power of compounding smaller profits is the key for your total capital.
Please share your thoughts and idea's below dear friends. What do you think and why do you think it with or without a chart.
I wish you all good luck with trading guys!
Disclaimer Traders this is my view, no advice to buy or sell. Also always do your own research!
--->> Traders please follow me for updates and give me support with a like 👍 if you like me to continue this work. Thanks 💚

Bticoin 30 minute chart 2 NEW Patterns - Check it out!Bticoin 30 minute chart New Patterns - Check it out!
Hello dear friends and traders,
There are some new developments on Bitcoin's 30 minute chart.
Bitcoin has already formed a Bearflag and is moving in this pattern. We also see the formation of a Head shoulder formation.
I expect up to 33700 as the highest point for the right shoulder, After breaking through the neckline we see the following targets:
31400
30500
29400
My previous analyses with several larger head shoulder formations are all still valid!
No long term prediction but trade what you see that is easy on your mind and gives no conflicts!
Please share your thoughts and idea's below dear friends. What do you think and why do you think it with or without a chart.
I wish you all good luck with trading!
Disclaimer This is my view, no advice to buy or sell. Also always do your own research!
--->> Dear friends please follow me for updates and give me support with a like 👍 if you like me to continue this work. Thanks 💚

Bitcoin appears to be trading in a bear flag!In dark blue, you can notice a bearish flag pattern forming with multiple bounces off the horizontal baseline of support and what appears to be a series of lower highs underneath a downward sloping resistance line.
A possible Macro H&S pattern would coincide with a blow-off top at the launching of Goldman Sachs bitcoin futures contracts, similar to late 2017 CME BTC futures contracts calling the tippy top. I have drawn a bearish hypothetical scenario in red.
On the RSI there is a series of higher lows indicating a potential bullish divergence taking place. A bullish divergence occurs when prices fall to a new low while an oscillator fails to reach a new low. This situation demonstrates that bears are losing power, and that bulls are ready to control the market again—often a bullish divergence marks the end of a downtrend.
On the KST there were recently two bullish crosses and it looks like a higher high may be created for the first time since the blow-off top in March/April.

Bitcoin BTC Bear FlagBTC here showing us a Bear Flag as well as a number of other bearish patterns. Bitcoin has been ignoring clear bearish patterns for the past couple of days, I don't expect this to continue.
I would not be surprised by a breakdown before the third rise to the top.
Invalidated if there is a strong break above 36.5k. If we see this, a bullish scenario will take place.


BTCUSDT, WRXUSDT and CHRUSDT Technical AnalysisWelcome back Traders, Investors, and Community!
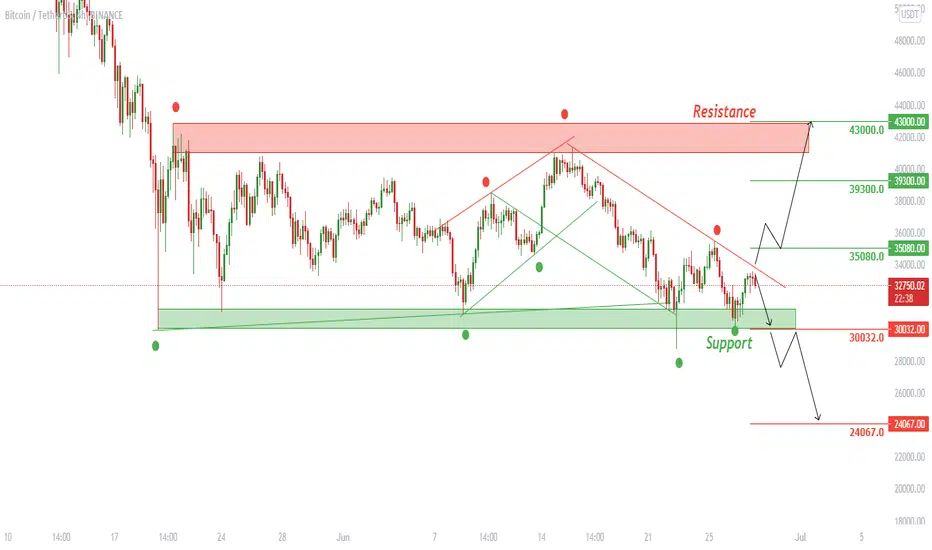
BTCUSDT is in the Bearish channel it seems to be rejected from the Bearish trend line. So if it continues to go lower from the bearish trend line it is expected to go at least to the Support zone which is around 30032.0 however if it was able to break below the Support zone (30032.0) then we need to expect potential entry in the lower time frame like H1 to go short with the target of 24067.0 after the retest the Support zone.
On the other hand if the price succeeded to Break above the Bearish trend line the price may go to the first Resistance line which is around 35080 for a retest before it heads higher. At the retest at 35080.0 in the lower time frame (H1) we can look for potential entry to go long to the next Resistance zone which is around 43000.0
WRXUSDT has been rejected by several red Doji candles at the Bearish trend line and the last candle is forming as a strong Bearish. So with that being said I expect the price after formation of this red candle goes lower to the Support zone which is around 0.666 before it returns to the Bearish trend line again. However it is possible before it goes lower to the Support zone it breaks above the Bearish trend line and heads up to 1.44
We might have pullback at 1.44 before it goes higher. Above the bearish trend line in the lower time frame we can look for potential entry at lower time frame to go long with TP 2.10
CHRUSDT on the H1 has formed a Bullish Flag which is a sign of Bullish continuation if it breaks above the Bearish trend line of the Flag. If the breakout happens we would expect a potential entry at the Bearish trend line of the Flag in the lower time frame to go long with TP 0.145
We already have 2 rejections from the bearish trend line of the flag which can be more before the breakout happens.
Traders, please hit the 👍 LIKE button if you like this idea and if you have your own opinion about this, please write it in the comment box. We will be glad for this.
We will have more FREE forecasts in TradingView soon
❤️ Your Support is really appreciated!❤️
Have a Profitable Day
Bitcoin down to 30100 then as a rocket to 35000, 42000, 47000 $Dear Friends,
How do things continue after the continuation of my previous analysis with Bitcoin?
We see here that Bitcoin is in a descending trend channel after forming a larger bear flag.
I expect a target of 30100 USD after which we will rebound like a moon rocket to 35000 USD ;-) We will then also have formed a new pattern, namely a reversed head-shoulder formation. As soon as we break through this neckline, we will also immediately go through the upper trendline of the bullish falling wedge.
This is followed by a retest of the neckline of the reversed head shoulder formation and immediately also the bullish falling wedge which has been validated and retested.
Then we probably will first see the price target of 40500 (upper boundery of the range, 42000 USD for the inversed HS formation. and then 47000 USD.
This could very well be the last time Bitcoin revisit the 30000 area. Nothing is sure but for me the pieces of the puzzle fit like a glove.

Bitcoin form a bearish flag; bearish signal!!!At the moment and analyzing in H4 timeframe, I see that Bitcoin form a bearish flag that we forming between yesterday and today. Guys, the moment to sell cryptocurrencies are putting for investor the option to get cash and for the moment, don't invest in cryptocurrencies. This drop could be a big crash in the crypto-markets as China take control over citizens to prevent to use Bitcoin, and that put a Bitcoin in the risk by the China Government. But guys, if you save cash in what you get profitable, you can to buy more cheap cryptocurrencies and more coins that you have now.
s3.tradingview.com
Now, if you look the H8 timeframe, Bitcoin it's making a pull back below of $35,000 USD key resistance in H4 timeframe, and I believe that Bitcoin it's not forming any bullish flag that I show you yesterday, just that Bitcoin could to continue crashing in the next days.
s3.tradingview.com
Now, based in this theory, Bitcoin could to crash 28% to go to $25,000 USD approximately or crash 50%, and that put a Bitcoin price to $17,000 USD. in any mode, if that occur, Ethereum, Cardano, XRP and cryptocurrencies going to suffer more.
Now, I put a sell order limit at $32,600 USD in my trading app with the SL at $34,000 USD and my specific target will be $25,000 USD.
***As I buy Cardano coins, I decide to sell again. In the morning, I tweet that I sold my Cardano coins to get cash for now, There's not any good moment to invest in Bitcoin or any cryptocurrencies as the trend it's becoming more bearish.

[Intraday] Tata Chemicals Short Bet Bearish Flag Short if triggers
Note :-
Entry - At the break of mentioned candle's low/high
Stop Loss -
In a Short Trade, I always use Previous Candle High ( PCH ) as a stop loss while entering the trade. Sometime I might use smaller tf SL & trade in 15M or 30M tf which I'll mention. Vice Versa for long trades
Trailing Stop Loss ( TSL ) - Mostly I trail stop loss by PCH as price falls . I exit as PCH breaks & vice versa
Use of PSAR indicator as TSL :- TSL get's hit in trend following due to noise, In such cases I use PSAR to be in trend & exit if PSAR direction change ( PSAR : Parabolic Stop n reverse )
You can use any one of above mentioned or your own way to manage risk
Time Frame :- I take ~ 90% of my intraday trades in 15m tf. Where my analysis might come from higher frames like W , D or 1hr chart pattern which will be mentioned.
Target :- I do set target line based on support / resistance slightly above/ below it . Please pay attention to it

[Intraday]UBL Long & Short Bet Buy If triggers
Sell If triggers
Note -
One of the best forms of Price Action is to not try to predict at all. Instead of that, ACT on the price. So, this chart tells at "where" to act in "what direction. Unless it triggers, like, let's say the candle doesn't break the level which says "Buy if it breaks", You should not buy at all.
=======
I use shorthands for my trades.
"Positional" - means You can carry these positions and I do not see sharp volatility ahead. (I tally upcoming events and many small kinds of stuff to my own tiny capacity.)
"Intraday" -means You must close this position at any cost by the end of the day.
"Theta" , Trade Setup based on option Decay !
=======
I won't personally follow any rules. If I "think" (It is never gut feel. It is always some reason.) the trade is wrong, I may take reverse trade. I may carry forward an intraday position. What is meant here - You shouldn't follow me because I may miss updating. You should follow the system I share.
=======
Like -
Always follow a stop loss.
In the case of Intraday trades, it is mostly the "Day's High".
In the case of Positional trades, it is mostly the previous swings.
=======

BTCUSDT Daily, Flag Pattern with 15k target !(not Confirmed Yet)Bearish flag pattern with 15000 target !!! after three drives harmonic pattern, ( not confirmed yet )
🙋 Please let me know what you think.
🚀 If you would like to be kept updated, please follow us.
🚀 If you like the analysis then do drop a LIKE and a COMMENT. Also do SHARE it with your friends.
🚩 Note - These are my personal notes and in no way a financial advice. Do your own research and Trade wisely

GBPAUD, 4hr tf, breakout of broadening wedgeRecently, price managed to break below the support of this ascending broadening wedge pattern.
Notice for price consolidate near the support before breaking below it. This consolidation looks like a bearish flag to me.
We could expect price to continue go down towards 1.8100 area. The target of this wedge is at 1.8092 but we will aim to take profit a little bit above the target.
Sell GBPAUD 1.8260
Stop loss 1.8320
Take profit 1.8110 (2.5R)
Use only 1-2% risk
Good luck

BTCUSD Recovery or a Bear Dump ? PP 0.236 @ USD 37,733 Even though past 4 hrs movement brought so much joy to Bullers, the next 1 hour will dictate the SMAs for the next few days.
PP 0.236 @ USD will become a key whether the sun will finally emerge from the dark cloud since last month.

NZDJPY on a bear flag 🦐NZDJPY is moving inside a minor ascending channel for a test of the 0.5 Fibonacci level.
According to Plancton's strategy if the price will break the flag we will set a nice short order.
–––––
Follow the Shrimp 🦐
Keep in mind.
🟣 Purple structure -> Monthly structure.
🔴 Red structure -> Weekly structure.
🔵 Blue structure -> Daily structure.
🟡 Yellow structure -> 4h structure.
⚫️ Black structure -> <4h structure.
Here is the Plancton0618 technical analysis , please comment below if you have any question.
The ENTRY in the market will be taken only if the condition of the Plancton0618 strategy will trigger.

Bitcoin (BTC) Bear Flag ActivatedBitcoin has activated the bearish flag chart pattern. A retest of the broken triangle can be expected before the downtrend resumes to below $30,000.
