National Oilwell (#NOV - US) Sell for 5th down. National Oilwell (#NOV - US) is in downtrend. It looks like 4th wave bear flag after big downfall. Sell with stops above 13.10 for target as new low in this time frame.
Bearish Flag

GBPJPY bearish flag continuation bearish flag look for breakout and retest on the lower time frame and execute

GU SellTrend line break and retest
Bear flag
EMA X script has indicated a sell
not the best entry . still a 1:1.8 risk to reward. Targets to be taken just before the -0.27 extension
There is also signs of the right shoulder of a head and shoulders pattern


Dax Short Term ForecastH4 - Triple cycle to the upside completed, price respected the key resistance zone and is moving lower.
Bearish divergence, the price has broken below the uptrend line.
Price still has room lower towards the key support zone formed by the 38.2% (10010) - 50% (9621.1) fibonacci retracement zones of the triple cycle.
H1 - Price is currently moving inside a bearish flag pattern. We have a key resistance zone formed by the 100% (10675.6), 127% (10737.6), 161.8% (10817.6) fibonacci expansion levels of the first wave, top of the bearish flag pattern and the H4 uptrend line.
Until this key resistance zone holds my short term view remains bearish here.
Break below the bearish flag pattern would validate this short term bearish view.


ELLIOT WAVE THEORY + TRIANGLE + BEARISH FLAGAs seen on the chart there are 3 ways that this pair could be shorted.
The range is as big as the TP is equal to the range.

Nifty 50 Index 1D NSE SHORT01) Flag Pattern (Bearish)
02) Price near rising wedge channel top
-------------------------------------------------------------
03) Entry - Below upper Trend line (Pink)
04) Target - White Horizontal line
05) SL - Above Swing High (above upper Pink Trend line)
-------------------------------------------------------------
Note : This study for educational purpose only.
-------------------------------------------------------------


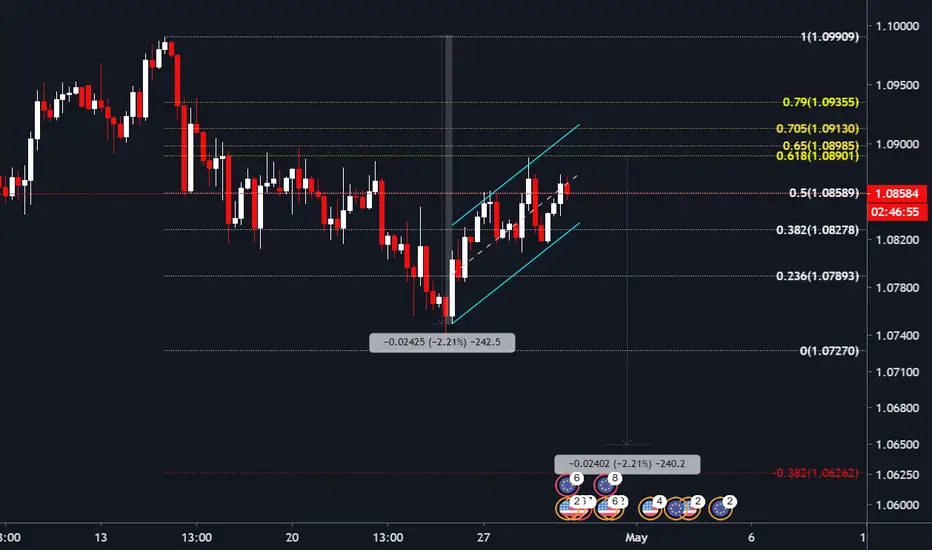
#EURUSD - Possible Bearflag as wellPrice rejected at .618
the trend is bearish looks like we will continue if H&S idea works out
then I will just keep moving my stops for the bear flag targets
#DYOR


#BAJAJ - Bear Pennant Clean continuation pattern forming, the descending triangle after the initial dump, expecting one more leg down, keep an eye on daily candle close as well possibly printing a pin bar here.

Is the next Major Crash Beginning?Is the next big crash starting?
OANDA:SPX500USD
I've been watching the S&P closely for the last month during our recovery phase. It's been a great ride up, but today it's starting to look like the cracks are once again forming.
The below analysis is as I see it. This is not advice. Please do your own research before entering any trade.
Signs of a potential reversal:
1. We have recovered to the point of reaching the "Golden Pocket", which is the idea place to open a short for minimizing risk, between the 50 and the 61.8 Fibs.
2. We have seen a bull flag formation on both the Daily and the 4hr, with both breaking down and out during the last trading session.
3. We rejected off the 50 day moving average on the Daily.
4. Moving average on Volume is reducing.
5. MACD line has turned and looks poised to cross down below the signal line.
6. CCI is trending down and fallen out of upward channel.
None of this guarantees that a crash is coming, but it's certainly got me interested.
Potential SHORT Trade Setup
ENTRY: 2740-2770 (Anywhere here)
STOP LOSS: 2970 - 6.89% (Clear those fibs)
TAKE PROFIT 1: 2320 - 16.73%
TAKE PROFIT 2: 2176 - 21.70%
TAKE PROFIT 3: Let run
RISK:REWARD: 1:2.4
As per normal risk management practice, once the trade starts moving, reduce your SL and potentially apply a Trailing Stop in a fast moving market.
Please DO YOUR OWN RESEARCH!!
Happy Hunting!

Trade Ideas Educator: USDCAD BatThere're a couple of trade-ideas within this chart.
1. If the market retraces back to the resistance(red) line, it will provide a shorting opportunity on an aggressive setup, with the best Reward: Risk within this trade.
2. If the market finds support at 1.3934 in addition a magic candle appears, I may engaged a countertrend trade as an ABCD Pattern setup.
3. A trading opportunity can also develop within the consolidation area as a bat pattern setup.
Personally I prefer setup(1) and (3) let see what does the market give us.

Bearish flagI have spotted a bearish flag on (USD/JPY H1) this pair is also in a down trend on the (H4) time frame I will look to enter below the break of the flag, this pair has potential for a nice short position. If you like my idea please feel free to like, comment, & share.

BTCUSD; A Fork in the Road BTCUSD has come to form nice Bearish Wedge on the Daily Chart. We must be very close to a direction decision as we are now being 'pushed up against the wall' of the 50MA & the huge downtrend line of resistance at the same time, both of which we have basically bumped our 'noggin' on 5 out of the 8 last days...
Also in play, what could be considered the Left Shoulder and Head have formed, now we're possibly headed down to $5800 range support for the beginning formation of the Right Shoulder.
Volume is dwindling as well. All of this looks Bearish, but the market is so tricky these days with all that's happening in the world with Economics and Pandemic issues.
Either Bitcoin will bust through the 50MA and Downtrend line and ascend to the $8000 range / 200MA area or begin to descend to $5800 support.
What's your sentiment?
Likes & Comments appreciated,
Thanks,
-HP

USDJPY-Weekly Market Analysis-Apr20,Wk2A bearish crab formed within the sideways bounce(red rectangle), if a break and close below the box could have an indication of a potential bearish flag pattern.
Trade has already engaged and shared with my community on Friday, let's see how this trade turns out.

Trade Ideas Position: USDJPY CrabA bearish crab setup from within the consolidation area of the potential bearish flag setup on both the 1-hourly timeframe and 4-hourly timeframe. Trade has already engaged.

BNBUSDT Bear Flag| Low Volume| Structural Resistance Evening Traders,
Today’s Analysis will focus on BNBUSDT, forming a bear flag under structural resistance, a confirmation will likely test structural support.
Points to consider,
- Trend Bearish
- Structural resistance being tested
- Structural support likely target
- RSI lower high projection
- Stochastics in upper regions
- Volume below average
BNB’s trend has been putting in consecutive lower highs, currently forming a bearish continuation pattern at a key trade location. Structural resistance is in confluence with the 21 EMA and the 1.414 Fibonacci Extension, BNB is likely to get rejected.
The RSI is in a lower high projection, currently trading at a neutral level. The stochastics on the other hand is in the upper regions, can stay trading here for an extended period of time, however lots of stored momentum to the downside.
Volume is declining, an impulse move is imminent at this key technical level, if bear volume arises, this will be in conjunction with the confirmation of the bear flag.
Overall, in my opinion, BNB is trading at a very key level, resistance is very strong and there is a valid bear flag. BNB has a high probability of breaking down bearish, continuing the overall bear trend.
What are your thoughts?
Please leave a like and comment,
And remember,
“In trading, everything works sometimes and nothing works always.”

BTCUSD UpdateIf it breaks to the downside we have an aggressive downwards measured move and a more conservative one as potential targets.

SPX BEAR FLAG ?Bear flag ? We will wait for a break down to confirm it
Possible target of the bear flag is under 2100 (New lows)
