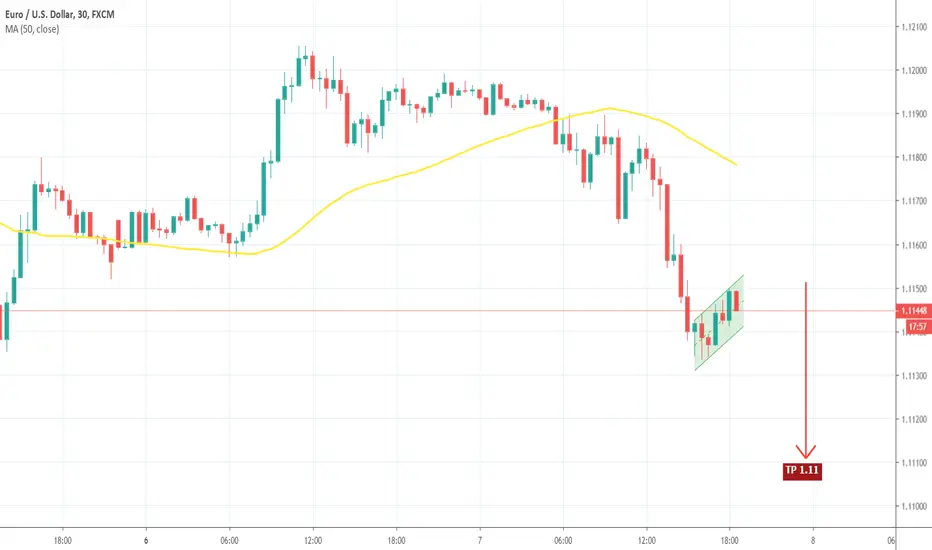
EURUSD STILL A SHORTEURUSD still a sellwe can see it has broken below the corrective channel, and is currently retesting the bear flag structure.
Bearish Flag

GBPUSD Potential Breakthrough As you can see the pair has respected the support trend line zone therefore we are looking forward to see a continuation of the uptrend. we are still waiting to so see if the market will break through the resistance line as a confirmation. Always remember that our job is not to predict the market, We RESPOND. Lets Win!
Instagram - Nadirfx

BTC ScenariosAs i said before BTC may still be in it's bearish trend ,because we can see a bearish flag. for A few reasons:
* BTC had a strong pull back from 3k channel:
* BTC is in a weekly bearish trend:
So if BTC break's the support and it's short time up trend it would confirm one or all three support areas
(DONT PANIC, I'm looking for a better entery point, We are going to moon after all right?)
If it doesn't free fall to 3-4k channels it could go up to 7k channel but still it need to correct itself after that strong pullback
Right?
And 3/4 time frame's MACD says it's time to have a little bit of red ones.(1H, 4H, 1D, 1W)
After all i hope you don't just take my word for it and lose all of your money over it ...
You aren't a complete moron are you??!
I'm just kidding smart *ss , bet 100% on me goddamn it 😂
(i'm not kidding)

ETH/USD - Bear Flag Spotted! (Trending Market)Hello friends! The price of Ethereum (ETHUSD) might be moving in a Bear Flag after a strong move, initiating a Trending Market .
We can watch the price consolidating in a upwards channel. The price hit the Resistance Line of the Channel at 153.17 followed by a rejection to 114.70.
The bears are still in control of the market, so please be aware of another heavy price drop.
A move towards 100.00 confirms the Bear Flag pattern.
I personally don't trade this pair and this idea - so please verify possible entries, exits and (trailing) stop-loss levels by yourself.
cheers,
cryptobuller

Bear Flag Continuation to 18000 ?I was hesitating closing my short on Link, but seeing a Bear Flag Target of 18,000 SAT, I'm taking the chance of leaving my Short Position opened
Good luck to all.
PS: I think my Fibs are accurate, so let's see if we can go to the 0.618 upon the confirmed break of the 1.618 which been acting as a Support for the past few days.
#TheColorChartist


ETHUSD 1D BEARISH FLAG PATTERN SHORT TRADEStep #1: Look for evidence of a prior bearish trend. For a valid bearish flag, you need to see a sharp decline.
Just because you can spot the bear flag pattern, doesn’t mean you have to jump straight into the market and trade it.
Remember, we need the right context and the right price structure needs to line up for a tradable bearish flag.
So, the first step is to identify the market trend prior to the flag price formation.
First, a valid bearish flag needs a sharp decline. This is strong evidence of a bearish trend and that the supply and demand is out of balance.
Note* The sharp move is also the Flagpole – the first element of the bearish flag structure.
Step #2: Identify the flag price formation. The price action needs to move in a narrow range between two parallel lines.
The flag price formation is the second element of the bear flag pattern.
Basically, all you need to do is to spot one support and one resistance level. It must contain the price action in a very narrow range.
The narrow range is key for the bear flag pattern success rate.
Step #3: Sell at the closing candle that generates the Flag Breakout.
After we identify the market trend and the characteristics of a good bearish flag pattern we need to wait for confirmation that the trend is about to resume.
There are two basic approaches to enter the market with the bear flag pattern. Aggressive traders will enter at the top of the bearish flag as this will secure a little bit of bigger profits.
If you’re a conservative trader you can wait for confirmation provided by the flag breakout.
Our team at TSG prefers to take the conservative approach and wait for a break and close below the bearish flag before executing the trade.
The bear flag chart pattern strategy only looks for trading opportunities when you get a breakout below the flag price structure to be a seller.
The next important thing we need to establish is where to place your protective stop loss.
It is important when looking at this type of strategy to keep everything in the context of the overall market. Too many traders will try to zoom on.
Step #4: Place the protective stop-loss slightly above the Flag.
The Rectangle chart pattern strategy gives you a simple way to quantify risk because you can place your protective stop-loss slightly above the flag price structure.
We’re accomplishing two things with our tight stop loss:
Small losses.
Higher risk to reward ratio.
With such a tight stop loss you’ll have the comfort of losing many trades in a row because with the amazing RR the bearish flag can potentially wipe out all your losses in a single trade and still come profitable.
The next logical thing we need to establish for the bear flag pattern strategy is where to take profits.
Step #5: Take Profit target equals the same price distance of the Flag pole measured down from the top of the bearish flag.
The textbook profit target is the height of the flag pole measured down from the top of the flag.
Our team at TSG has learned that the market likes this kind of price symmetries and we like to take advantage of it.
Note*** The above was an example of a SELL trade… Use the same rules – but in reverse – for a BUY trade, but this time we’re going to use the bullish flag, or bull flag.

Colgate Looks Weak (Short)FMCG giant COlgate Looks Weak
Bearish Flag Under Construction
If Breaks Below Flag Fresh Downside till the target Area is expected Stop Above the EMA
Do Your Own Analysis Before Taking Position

Possible bear flag on Ethereum chartEthereum was unable to break the current short-term downtrend.
A possible bear flag is forming.

BTCUSD, triangle within consolidation/correction channel in BTCHello everyone, triangle has formed within bearish flag pattern. This flag/channel could mean continuation in price decline. What I am looking for is for the triangle resistance or support line to get broken before entering. If resistance is broken first, I would like for the green candle to close above it (or very close to it), and enter the trade after first red candle forms. If support is broken first, then I will enter short trade when red candle closes bellow it. So, as soon as my conditions are met, I will buy some “red options” (on red candles, max 10).If flag/channel resistance line gets broken before my entry conditions are met, I will re-evaluate this set-up. My rules are the same as before:
If you have questions about candle color options or wish to discuss trading strategies in real time, join - candle color options - chat, right here on tradingview.
Rules:
7.Worst case scenario: if I will have 4 losing candles in a row, I will take my losses and look for a new set-up.
8.Best case scenario: If I will have 4 winning candles in a row, I will gladly take my profits and look for a new opportunity.
9.I will not trade more then 10 candles in a row and I will stop trading if I am up by 4 winning trades.
For example: if my first candle is a losing candle but the next 5 candles are winners, then I will stop trading, since I will be up by 4 wins (5 wins - 1 loss = 4 wins).
Please follow, like and comment !

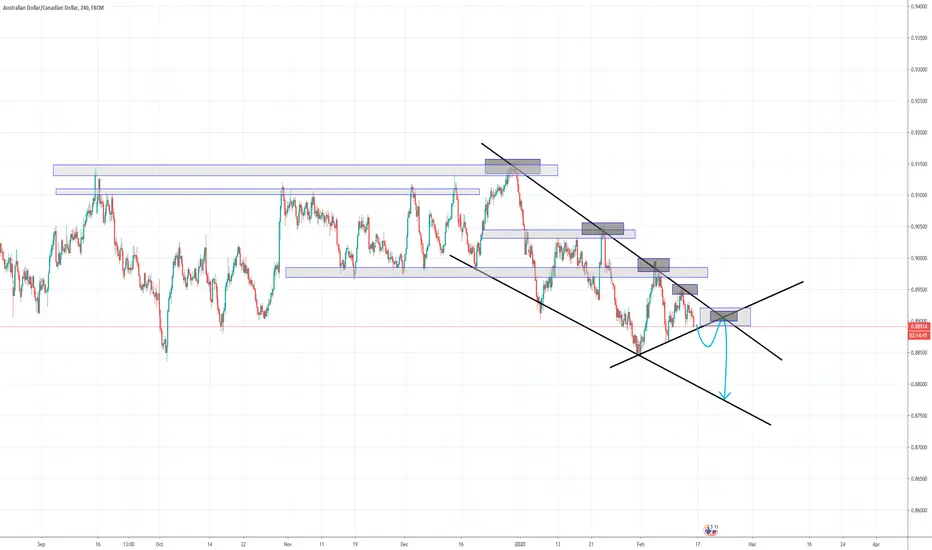
AUDCAD Short IDEAThis is my thoughts on the audcad bearish scenario.
NOTE there will always be a bullish scenario so see to it that my analysis matches your own before considering this trade.
ETH USD 15 m Bullish divergence on RSIETH / USD
15 minutes
Bullish divergence on RSI
We will probably see a local rebound. to the mark of $ 270
The medium term is still looking down.
Full testing of the Double Top pattern will be around $ 222.
The nearest target levels are indicated on the chart.
This is just my opinion, not a call to action)
Looks nice? Leave a like, share and leave a comment.
Thank you for your visit.

AUDNZD Short ComingAUDNZD is currently forming a corrective pullback within an ascending channel aka bear flag. Look for price to do one of two things; either 1. push up one more time into resistance for a clean short entry or 2. impulsively breakout out of the channel and head toward the -27% Fibonacci extension. You can also see a head and shoulders pattern with price currently forming the right shoulder. This is a great set up heading into next week & a good risk to reward. I will state that is a short term trade, and once price reaches the 1.03700-1.03500 area we will analyze how price reacts at support. I am not a financial advisor. This is not financial advice. This is for educational purposes only.


BTC.D: Don't Underestimate the TD Sequential 9 & 50 Week MAAs can be seen on the Daily chart using the TI Indicator, we are currently at the 50 Week MA on a Sequential 9. While the long-term 200 Week MA is sloping downwards (has a bearish posture), the 50 Week MA is rising (has a bullish posture). It's also clear from previous TD 9's, whether buy or sell signals, have been very reliable in calling short-term tops and bottoms. The RSI is also considerably oversold.
I'm still bearish on Bitcoin dominance long-term, but remaining neutral as dominance is likely to find short-term support from current levels. It'd be reasonable to believe that dominance will retest the bear flag breakdown level, VPVR resistance as well as 21 Day MA around 66%, or even as high as the 200 Day MA at 69% that is now started to slope downwards confirming long-term bearish pressure.
TI Indicator: tonevays.com
Altcoin Dominance Eyeing Up A Breakout to 40% (January 2020)
Cyrpto Market About To Bullcross: 50 & 100 Week MA (January 2020)
Altcoin Speculation Coming Soon... (October 2019)
Altcoin Dominance Bouncing From 0.382 Fib Retracement (September 2019)


USDJPY 1D BEAR FLAG SHORT TRADEBear Flags are in the Range chart pattern family group.
Bear Flags are repeatable trading chart patterns.
Bear Flag chart patterns will have a directional bias depending on the previous incoming trend.
Each chart pattern will have defining trendlines of the support/resistance levels creating the pattern.
What ever time frame you are trading this chart pattern, wait for a candle close outside of the trendline in the direction of the breakout candle. (Our time frame preference is the Daily chart).
Add volume indicator - Volume is the amount of $ that went into a particular candle or in Forex the # of trades that took place.
Add ATR indicator - Volatility is the amount of price movement that occurred. Use the ATR to measure the price movement.
When you see descending Volume bars and descending ATR line (which indicates volatility) this shows
a dis-interest in traders to invest in this pair creating consolidation which creates the chart pattern.
Trade Management after there is a breakout candle close.
1 - Position size (compare volume bar to volume ma line).
a - Breakout candle must be 100% of average volume for a full position size.
b - If 75% of average volume then ½ position size. (To find 75% of Volume
look at the charts volume settings – divide smaller # into larger # = 75%+)
2 - Enter two trades.
3 - SL for both trades will be 1.5 x ATR.
4 - 1st trade TP will be 1 x ATR.
5 - No TP on 2nd trade – letting profit run and adjusting SL to follow price.
6 - When 1st TP hit – move 2nd trade SL to breakeven.
7 - Adjust the 2nd trade SL to follow price.
*8 – After Breakout candle – if price closes back into chart pattern close trade
*9 - When breakout candle is more than 1 ATR from breakout candle open.
a - Enter 1st trade at candle close with ½ position size.
b - Enter 2nd trade with a pending limit order that is 1 ATR of breakout candle open.
c – Price should pullback to that pending limit order for 2nd trade.
d – If Price returns back into chart pattern close trade before SL is hit.


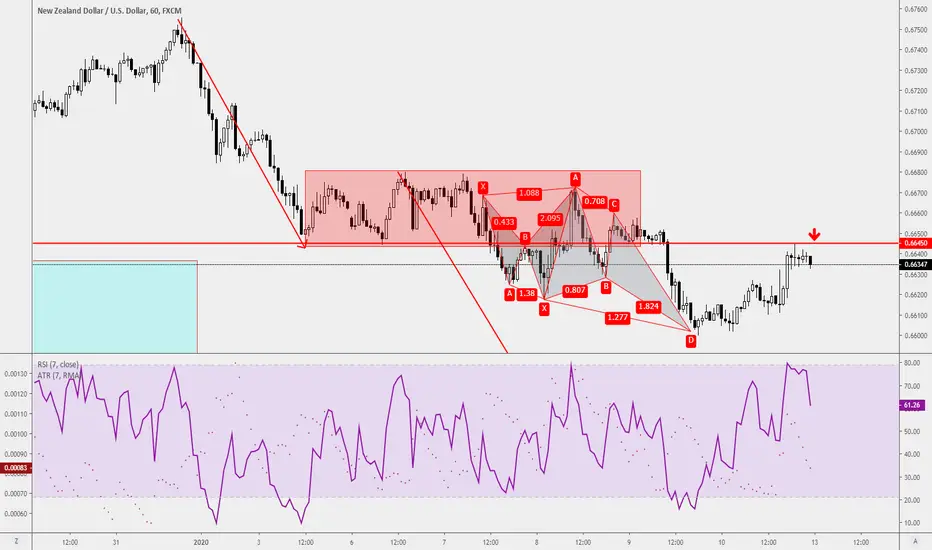
Trade Ideas Educator: NZDUSD ResistanceLooking to short at the resistance(red line), yes, just that. The bearish flag pattern has confirmed after a break and close below of the pink box, looking for trade extension towards the downside. A double top or a retracement after a bearish engulfing candle will enable me to engage this trade.
AUDCAD Bearish FlagBegun looking in to and back testing Flag patterns. Here's one I spotted while doing my usual checks of the charts.
Bottom chart is the 1440 showing us that we're still in a downward trend and have been since the first half of 2019.
Top chart is the 240 showing an initial impulse legs or flag pole, with a nice retracement.
I'd be looking to go short once price breaks and closes below the bottom flag line.
Two options for Stops and Targets.
Option A - Stops one ATR above the highest wick in the patterns and targets as an equal measured move.
Option B - Stops one ATR above the entry signal bar and targets at a re-test of the low.
Let me know what you think, any tips for someone who's looking to incorporate Flags in to my trading?

Radcom Inverse H&SLARGE Inverse H&S, a bear flag has also formed, which will most likely lead to further downsides with the presence of a tightening gaussian channel. If the bear flag collapses some nice symmetry will be seen.