AUDUSD 4H HOW FAR WILL THESE BEARISH FLAGS FALL4H chart is plotting several bearish flag patterns
How far will these bearish patterns continue to fall
Bullish pullback is going to happen.
Price can continue to fall bearish
Or bounce back bullish.
Bearish Flag

GBP/AUD SETUP - possible entry and stop loss included Hello all,
I have a potential short setup for you.
A bear flag has emerged on the GBP/AUD pair on the 4 hour chart.
Enter on a breakdown of the bear flag.
_______
(possible) entry: 1.7683
(possible) stop loss: 1.7790
(possible) 1st profit target: 1.7620 (pivot low of the trend leg)
--from there on trailing stop losses accordingly--
______
Remember, only use this trade idea in line with YOUR OWN trading strategy. This is the bare bones of an idea that should only be implemented in conjunction with your own trading system.
Also, PLEASE KEEP IN MIND the ongoing Brexit developments which may lead to unpredictable fluctuations in price. In particular, the two leading candidates in line to become Prime Minister next week have both publicly stated that they are open to the idea of a No Brexit situation concerning the October 31 deadline. This has caused some political friction within the UK Parliament and with the EU.
Happy trading!

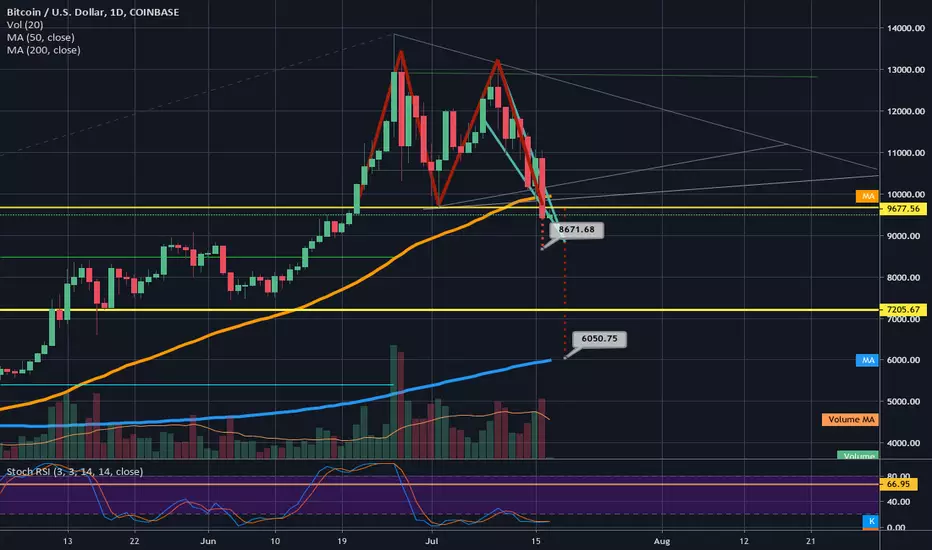
Possibility of a doubletop in play; if triggered 6k target. a large price dump that was instigated by a 3hr chart deathcross has us now potentially about to break down from what looks like a double top on the 1 day chart...price action is currently below the neckline and is right now trying to retest that neckline...if the retest is rejected then odds are good we will break down from the double top and retest the 1 day 200ma down at 6k. However I wouldn't be sure of a rejection until at least 1-2 1day confirmation candles + bearish volume surge to go with it...we are also currently testing the breakdown of a 1hr bear flag pattern which could dip to 8.6k. If we go to 8.6k odds are very good we will be filling the 8.5k gap from the CME futures chart....whether or not we'd reach the full dip target of the double top of 6k is uncertain considering there is also the famous "golden pocket" on the fib retracement right at 7.2 which we also had a small gap on on the cme futures charts....so dipping to the 7.2k zone would fill the final gap below us and reach that always magical bounce level of 61.8%. We can see the 8.5 level also hits a very significant fib line as well as it has confluence with the 50% retracement line. So we may see bounces at both of these zones or support for candle closes. However 6k is also a possibility because of the double top which also has confluence being double reinforced support with the 1 day charts 200ma which should provide solid support. My move is going to be to wait for price action to retest the yellow neckline of the double bottom and if the daily candles confirm solidified resistance I'm then going to short and ladder out portions at a time at a couple pips above 8.6, 8.5, 7.2, and 6.1k respectively...until I get the confirmation of resistance/rejection at the neckline however I remain neutral for now...with slight bias temporarily to the downside. During this downtrend we may see some altcoins make gains against btc such as xrp. I also believe that when this correction is over the next leg up bitcoin will be taking alt coins with it and they may even lead the 2nd leg up. I think the next temporary leg down on btc will coincide with a 4day deathcross and the next significant longterm leg up will coincide with a 3 day golden cross.
GBPUSD-Weekly Market Analysis-Jul19,Wk3Daily Chart(right) pose a bullish shark formation as a counter-trend trade To a nearer short-term(left) it does have a head and shoulders setup that present a counter-trend trade and I'm taking as a counter-trend trading approach and I'm going to shift stops to entry when market opens.

BTC breakout soon.. r we heading to $9K ?decreasing volume.. price is squeezed between 21 EMA and 100 EMA.. breakout soon.. where r we going? i think it is heading down to test a lower low.. with the confirmation of a bear flag formation.

EURJPY Sell IdeaD1 - Price is moving inside a bearish flag and holding below the downtrend line.
Until the price holds below this dynamic resistance my view remains bearish here.
H4 - Hidden bearish divergence.
We may now look for more evidences of bearish pressure in order to join the bears.

GBPJPY Update: Bearish Flag And Fresh Short OpportuityAnother Bearish Flag Pattern.
Sell the potential breakout
Levels as described

2hr bear flag breakdown 2hr deathcross now likely to occur10507 projected drop target may bounce up off the 1 day falling wedge's top trendline as support or go back inside the falling wedge...hard to say. Could also still be a breakdown fakeout bu that seems unlikely.

USDJPY breaking to the low (Lots of PIPS to catch)Price broke a descending channel at 107.200 to reach a resistance level at ~108.000. At that price, the pair has bounced back lower from a strong resistance with indications that a downtrend is forming. We currently have an ascending channel/bearish flag which indicates an upcoming breakout to the bottom.
Price has also been heavily rejected at 107.850.

EUR/JPY Wave analysisThe counter is in a long-term bearish trend.
However, the short-term trend suggests a short-term sideways trend.
The range is defined in a bearish flag formation and it is the wave 4 of the bearish cycle.
We expect the pair to wither the sideways trend upon reaching the resistive trendline and restart its bearish trend.

eurusd bearish move.overall move for eurusd is bearish with blue trendline respecting price on the weekly.
on the daily I see price reaching D resistance zone (green), diving deeper into the 1hr, I see price created this upward channel with price now reaching d resistance zone.
on the 15min, price created a bearish flag pattern, waiting for price to break out and continue moving impulsive.

uk oil bullish move.uk oil has been in downtrend for a very long time now with price making a bearish flag on the daily chart.
Waiting for price to complete the bearish flag with one more move up, I say this because price made a double bottom and retested previous support so I am hoping price does the same before melting down at the top of the flag pattern.

GBPAUD Bearish FlagIn my opinion, it's a bearish flag by watching HTF which give an idea that momentum is strong for downside and it will break soon downside of this Channel after the formation of Double Top or H&S Pattern on top of FLag

bitcoin short term setup 17.45% GAIN!!!!!!BTCUSD has reached resistance zone and delving into lower timeframes, I see that price is in a channel where it has reached the blue resistance line as well as the yellow resistance line which is 2 confirmations.
Price than came back down and formed a bearish flag pattern which is creeping back up the yellow resistance zone. Waiting for retest off that area which gives me confirmation that market is about to go low.

eur/nzd short term set up.Euro has its ECB meeting couple days ago and the market was looking very bearish news came out.
Weekly timeframe shows no indication of momentum however, if we delve into the daily we can see a bearish flag pattern.
Inside that pattern, we see 2 bear flags on the 4hr and 1hr as well which shows the continued momentum the sellers have. Remember guys impulse and correction moves are all we need to figure out where the market is going.
Entry, stop loss and take profits are all listed on this.

EURCAD Sell IdeaD1 - Price broke below the bottom of the channel.
H4 - Lower lows, we may now look for corrections and then sells with bearish evidences.
H1 - Currently it looks like a flat correction is happening in the form of bearish flag pattern and the price has broken below the bottom of it.
We may now start looking for sells with more bearish evidences.

USDJPY - Bear Flag Looking Ripe For A Tradebear flag looking really bearish, market structure creating lower highs throughout and the trend has been touched over 3 times signalling a sell opportunity.
two ways to take this trade :
1. await the close and take the trade
2. await the retest for OTE (optimal trade entry)
message me to receive free trades daily...

2618 Short Setup EURAUDLast higher low is broken and highlighted area is the potential reversal zone.
2618 and bear flag strategies can be seen on the chart. Just waiting for a price action signal.
Good luck all.

CHFJPY Sell IdeaD1 - Price is moving inside a bearish flag and is holding below the downtrend line, potential bearish hidden divergence.
H4- We have two critical zones that has formed based on the fibo levels of the cycles, the top of the daily bearish flag pattern and the daily downtrend line.
Price has currently reached the first critical zone, bearish divergence. Until this critical zone holds may expect bearish moves.
Alternatively if the price moves higher then the next area to look for bearish setups with bearish evidences would be the second critical zone.
Invalidation: If the price moves higher and breaks above the daily downtrend line then this sell idea would be invalidated.

BTCUSD - Bear Meat to fuel the next Bull RallyThere is a Bear Flag forming on the short side of things. This should help pull down the RSI, MACD, Stoks, etc. etc. So long as we don't break the multi-year trend line from my other charts and the 20/40 week moving average remains crossed (which it did last night) All these Bears are going to get skinned and their meat used to fuel the next Bull Rally. Not only will the Bulls be buying hand over fist but the shorts will be right there with them doing the same. The next couple of weeks should be exciting !
Good luck!
(My weekly update below)

Bitcoins Upwards Trend Line in Danger or Just a RetestHere we can see how ETH followed the 'rules' quite well, with staying below that resistance. For bitcoin it was more difficult to determine that level. Rather had seen it stay below the 8700ish. But it was weekend and they pushed it up with very low volume all the way up from the 8300/8400.
Now we can see why they did it, because volume was that low, they created a stop loss zone for shorts and pushed it up from the 8600 to eventually 8850 even. Why i think this theory is likely, because we moved up with very low volume, but even more, selling volume was much bigger at those 2 drops. Even looks like that final push up from 8750 to 8850 was just to close longs or fill up shorts.
These are theories that can be a bit subjective, so now to the facts. On the left we can see a clear up trend line, which we are testing once again. So normally if it breaks with good volume we should see at least a retest of the green support on the left. At this point it's very likely to happen, unless we see that bear flag range (in the middle chart) fail. So we should stay below the 8550ish from now on. The longer we hang around that red trend line, the bigger the odds it will break.
Previous analysis i talked about an ABC correction, where we possibly even completed it with that big drop few days ago (similar to 2 weeks ago, yellow circles). But with this drop and the reasons described above, good chance that it might become a normal bigger ABC this time. The target of C wave, is IMO always a subjective thing. Usually it's a similar size as wave A (so around 1000/1200) so a drop to like 7900/7900. But it could hold above 8000 as well but also drop much more even. A lot will depend on the volume. That volume shows the market intentions a bit. On the daily we can see that volume is still showing that bull trend is in favor. No matter what my thoughts on lower time frames are, i don't become really bearish until i see a big sell volume candle, reaching those yellow circles. So even if i would be bearish now, i don't assume the trend for the coming weeks/months will be down again up until we see that big sell volume. Also means, if sell volume doesn't start to
To give an impression of this, chart below shows a few of the previous highs in 2018. During the 5K movement a month ago, i kept mentioning this fact, that as long as we don't see this, we should not assume that the high is set already. I saw many people already thinking that the high is set already because of numerous reasons. Those reasons were legit, normal TA, but you simply can not ignore the King of all indicators, which is volume. Volume are buyers and sellers and the buyers and sellers determine all the TA patterns and all the indicators out there.
Anyway, for now i think we should keep it simple, bears are a bit in favor here at this point. As long as the bulls don't break this bear flag in the middle on the upside, chances of a break of that red trend line remains likely. But we should also not forget, as long as it doesn't break, it's simply still is a upwards trend line. For it's just always a sign, that when we see a drop at nr 1 and then a second test, without being able to make a higher high first (so break the break the 9000ish first), it can be a sign of top formation. Or at least that it needs more consolidation before moving up again. If this last case is what we are seeing now, it could be we are going to see like an upwards triangle from 27-05 at the 8000. As i have drawn on the left. Of course anything is possible, but seeing a second triangle immediately after the one we had at 6800/8400 a few weeks ago, is not likely.
So my short term view is down, as long as we stay below the 8550ish and for ETH around 265/7. Before i forget, in the beginning where i talk about volume increase if we do drop and break the bear flag, we should see it increase from around that yellow circle at 8350/8400.
Please don't forget to like if you appreciate this :)
Previous analysis

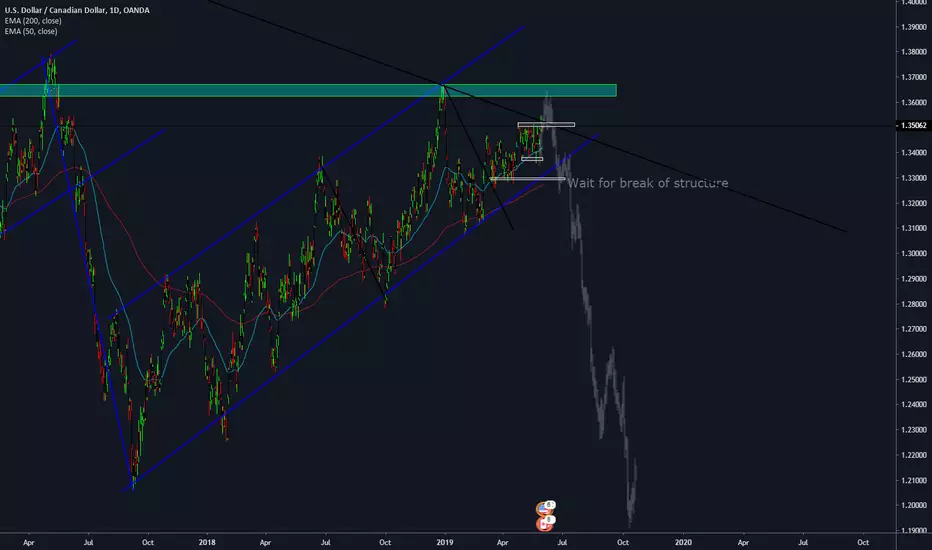
USDCAD 1,700 PIP DROP INCOMINGAs you can see, we have a series of bearish flags.
I am looking for price to double top off 2k18's previous high at the 1.36500 level before declining.
I'd wait for nice daily priceaction off the highlighted level for a risky entry
for a safer entry id wait for a break of structure
it would also create MACD divergence
Signifying sellers coming into the market.