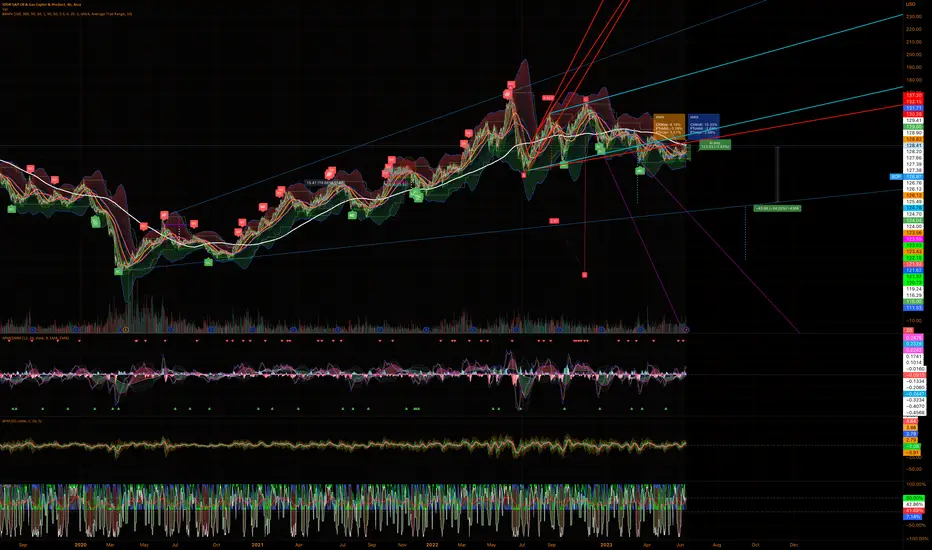
Until DXY beats this price, this is just a bear flag!Traders,
The dollar continues its journey down. So, is my H&S pattern still intact? Well, on the weekly it is. Does that count? I think so.
It's not like the dollar has turned the corner here and growing stronger. We are still very much in a downtrend. Even that right shoulder is still valid. And, like I said, on a weekly chart that neckline still holds. Once broken, the dollar is in trouble.
What would invalidate my H&S pattern? Well, if the dollar beats that 50 day moving average and then proceeds to move up and above that 103.53 level with confirmation, I might be wrong and would have to re-evaluate at that point. Until this time, the DXY has formed a classic bear flag and I expect weakness to continue. The weaker the dollar, the more dollars it takes to buy a thing. The more dollars it takes to buy a thing, the higher the prices will go to reflect what is needed. This includes stocks.
Stay tuned as we keep our eyes on this unfolding event.
Stew
Bearish Flag

EURCAD I Bearish flag breakoutWelcome back! Let me know your thoughts in the comments!
** EURCAD Analysis - Listen to video!
We recommend that you keep this pair on your watchlist and enter when the entry criteria of your strategy is met.
Please support this idea with a LIKE and COMMENT if you find it useful and Click "Follow" on our profile if you'd like these trade ideas delivered straight to your email in the future.
Thanks for your continued support!


✅AUD_CHF BEARISH BIAS|SHORT🔥
✅AUD_CHF is trading in a
Downtrend and the pair has
Formed a bearish flag pattern
So IF we see a bearish breakout
Then I think that we will see
A further move down
SHORT🔥
✅Like and subscribe to never miss a new idea!✅

BNBUSDT update 4h - BEARFLAGBNBUSDT bearish scenario on 4h chart. Price action expected as a bear flag pattern breakdown, plus reciprocal AB=CD harmonic pattern plus Chaikin Money Flow bearish divergences in confluence w/ greater demand zone.

Correction to Last Vid ...June 4th NOT June 23rdTraders,
I made a critical data error in my last video in stating that the level we were looking to beat to become more optimistic was June 23rd. That is NOT correct. The date we are looking to beat is June 4th, the day before the SEC lawsuit again Coinbase and Binance was announced. So, you want to draw a horizontal line from that body high on that date as demonstrated in this correction video here. My apologies traders.
Stew

Mastering the Bearish Flag Pattern in Forex and Gold Trading
The bearish flag pattern is a powerful technical analysis tool used by traders to identify potential bearish trends in the foreign exchange (Forex) and gold markets. As a continuation pattern, it is typically formed after a strong downward move, indicating a short-term pause before the price continues its downward trend.
📚How Does the Bearish Flag Pattern Work?
The bearish flag pattern is formed when the price experiences a sharp decline (the flagpole) which is then followed by a short period of consolidation (the flag). During the consolidation phase, the price usually trades within a tight range, with lower volume, indicating a temporary balance between buying and selling pressures.
The pattern is confirmed when the price breaks below the support level of the flag. This indicates that the selling pressure has now become bullish, and traders can expect a continuation of the downward trend.
📉Trading the Bearish Flag Pattern
Traders can take advantage of the bearish flag pattern by entering a short position after the flag pattern has been confirmed. This means that the trader will be selling the asset in question, expecting it to continue its downward trend.
To increase the likelihood of success, traders can use other technical indicators, such as moving averages and oscillators, as well as fundamental analysis to identify potential price movements and market trends.
Here is the example of a bearish flag pattern that we spotted on Gold.
After a sharp bearish move, the market started to consolidate within a horizontal range - flag.
Its support breakout was the indicator that the market returns back to a bearish trend.
📈Bullish Flag Pattern
The bullish flag pattern is the exact opposite of the bearish flag pattern, indicating a temporary pause in an upward trend. It is formed when the price experiences a sharp upward move followed by a short period of consolidation before continuing its upward trend.
Trading the bullish flag pattern is similar to trading the bearish flag pattern, with traders entering a long position after the confirmation of the pattern.
Here is the example of a bullish flag. The signal to buy was a bullish breakout of its upper boundary.
Behold how quickly the market started to grow then.
In conclusion, mastering the bearish flag pattern is a valuable skill in Forex and gold trading, allowing traders to enter short positions with greater confidence and accuracy. By combining technical and fundamental analysis, traders can identify potential trading opportunities and reduce their risks. It is important to note that a similar strategy can be applied for trading the bullish flag pattern, which is equally useful in identifying potential profitable trades in an upward trend.
What do you want to learn in the next post?

Altcoins! June 23rd, Channels, and Current InterestsTraders,
As promised, I am doing a quick overview of current price action in our altcoin space. I will cover an important date, June 23, and why it matters. I will also review the channels that are forming on most alts which appear as though they could be mid-term bear flags. And finally, you will see me review some of my current trades and what I am looking at for targets, stop limits, etc. Enjoy.
Stew
Timestamps
00:00 Intro
09:17 Altcoins
11:27 DogeCoin
16:00 Defi Coins
19:34 Outro

Bearish flag, early callPrice is forming a bearish flag, it makes sense I expect Canadian Dollar to gain strength and the Aussie to keep falling. Wide stop loss here, Forex is highly volatile. You can open a small position here and add at the break down.

🔥 MATIC Potential Bear Flag Forming: 2 In 1 Signal!After weeks of selling, MATIC seems to have found support and has been trading inside a bullish channel for over a month now. A bullish channel after a strong sell-off often results in a bear flag pattern, which is a continuation of the bearish trend.
Looking at this chart, we can construct two different signals.
The safest trade would be to wait for the price to fall through the channel's support and enter once the price has closed below it. A more risky trade would be to enter from the to resistance, around the current area. Bot trades have the same target: the current bear market bottom around 0.32. The potential win of the risky trade is much higher because of the tighter stop and the further profit target.

SILVER Bearish Flag Pattern! Sell!
Hello,Traders!
SILVER is in the downtrend
And it has formed a bearish
Flag pattern so IF we see
A bearish breakout then
The Silver will go further down
Sell!
Like, comment and subscribe to help us grow!
Check out other forecasts below too!

BNBUSDTPrice action in BNBUSDT is absolutely bearish, and I expect a new lower low soon, even if we get a recovery rally in the short term.
The 100% extension of the previous downswing sits at 171.70, which would be my first target.

240 MINS TIME FRAME - RAYMOND STOCKThe Structure looks good to us, waiting for this instrument to correct and then give us these opportunities as shown on this instrument (Price Chart).
Note: Its my view only and its for educational purpose only. Only who has got knowledge about this strategy, will understand what to be done on this setup. its purely based on my technical analysis only (strategies). we don't focus on the short term moves, we look for only for Bullish or Bearish Impulsive moves on the setups after a good price action is formed as per the strategy. we never get into corrective moves. because it will test our patience and also it will be a bullish or a bearish trap. and try trade the big moves.
we do not get into bullish or bearish traps. We anticipate and get into only big bullish or bearish moves (Impulsive Moves). Just ride the Bullish or Bearish Impulsive Move. Learn & Know the Complete Market Cycle.
Buy Low and Sell High Concept. Buy at Cheaper Price and Sell at Expensive Price.
Keep it simple, keep it Unique.
please keep your comments useful & respectful.
Thanks for your support....
Tradelikemee Academy


I Cannot Long This !!!Hello
The USDCHF currency pair is in a bearish phase by reaching a PRZ zone.
⭐ Bearish signs in the PRZ region are:
- Trend line
- Descending channel breaking
- Moving MA50
- Weekly pivot
-Fibo 50%
⭐ and the downward signals of market momentum are:
- Hidden Divergence in MACD
- Time divergence in the last 2 waves
➡️Note that you should wait for the break of the trend line and pullback to it, or enter the market after seeing strong bearish candles.
✅If this post was useful for you, like it ❤️ and if you think it is useful for your friends, be sure to send it to them.
_ _ _ _ _ _ _ _ _ _ _ _ _ _ _ _ _ _ _ _ _ _ _ _ _ _ _ _ _ _ _ _ _
🌍Thank you for seeing idea .
Have a nice day and Good luck.

ETHEREUM long setup Hello Traders, here is the full analysis for this pair, let me know in the comment section below if you have any questions, the entry will be taken only if all rules of the strategies will be satisfied. I suggest you keep this pair on your watchlist and see if the rules of your strategy are satisfied. Please also refer to the Important Risk Notice linked below.

UVXY Potential Early Bear Flag Channel Entry at Moving AveragesThe UVXY is currently trading at the 89 Day EMA among other Moving Averages that it's often reversed from; if it reverses from here again and hits the bottom of the Potential Parallel Channel that will confirm the Validity of the Parallel Channel. If it breaks down from this Parallel Channel that will be a Bearflag breakdown that could take it down anywhere betwen the 1.618 to even the 2.618 which should signal a rally in the SPX. For the time being this is a speculative early entry.

Bearish flag breakout in EOSEOS has broke out of its bearish flag in 1H timeframe and now is moving downward; Entry: 0.68, TP: 0.47, SL: 0.70

FTM forming bearish flag FTM is forming a bearish flag in 1H timeframe and upon breakout can give a good profit on short position; Entry: 0.25, TP: 0.20, SL: 0.26

$83 bearish flag before some bullish activitythere i a bearish flag pointing to $83, we don't have yet, any bull formation, the bull formation is in progress and could e another flag that take us up to $190, but now the bear flag is dominating and strong.
General Motors: Bear Flag Bearish BacktestGeneral Motors after getting the TSLA Charging Plug collaboration news was able to generate enough energy to come back up to test the Bearish Channel and 55 Week EMA and from there it got a moderate rejection from it. This could be just the start of a greater move down to the zone between the 0.786 and 0.886 Fibonacci Retraces.
I could aslo see a scenario as to where GM and Ford Motors comes down as the Charging Station Stocks such as ChargePoint and maybe Blink rebound back up, as the moves between these after the news report were opposite of each other and they have two opposing setups.

ENSUDTENSUSDT currently trading in bearish flag pattern, as there is no significant bullish divergence on the pair, will the ENSUDT break flag to downside to continue its bearish trajectory ?

✅GBP_CAD BREAKOUT|SHORT🔥
✅GBP_CAD is trading in a
Downtrend and the pair
Broke out of the berish flag
Which reinforces our bearish
Bias and I think that we
The pair will keep falling
SHORT🔥
✅Like and subscribe to never miss a new idea!✅
