Bearish Gartley

Bearish Gartley with Potential Bearish DivergenceI have identified a harmonic pattern known as a bearish gartley on the weekly chart for XRPUSD. While I think there could also be hidden bearish divergence on the oscillators, I am told that the divergence is not confirmed until it starts waning, which it has not. Regardless, the pattern is only invalidated if the price of Ripple exceeds point X, which is essentially 35 cents, which is a tremendously difficult area of resistance for XRP. For that reason I think this trade setup is lower risk, but I suppose if BTC continues to rise, XRP might follow and invalidate the pattern.


Sterling Pound is weakness agains the US DollarThe influenced by Sterling Pound it's moving for US Dollar, this par is so negotiate, so we ha a bearish Gartley that we could see a possible correction of the price in some days.
Now, looking in Daily timeframe we see a formation of bearish rising wedge, I can't updated my technical analysis yesterday at night because I am sleeping so early, but now, we have this situation and the probability to see a Sterling Pound is so look bearish.
And in H1 timeframe, we see the same sitaution that Sterling is so weakness!!!
***And also, using MACD and RSI show a bearish divergence in both timeframe in H1 and H4 timeframe.

Dabur - ShortDabur had Wolfe wave on hourly chart and now it completed Bearish Gartley on daily chart. Excatly at Potential Reversal Zone. Also at Supply zone which confirm shorting dabur ... Targets on chart
Stop Loss above 525 and for safe trader above 500

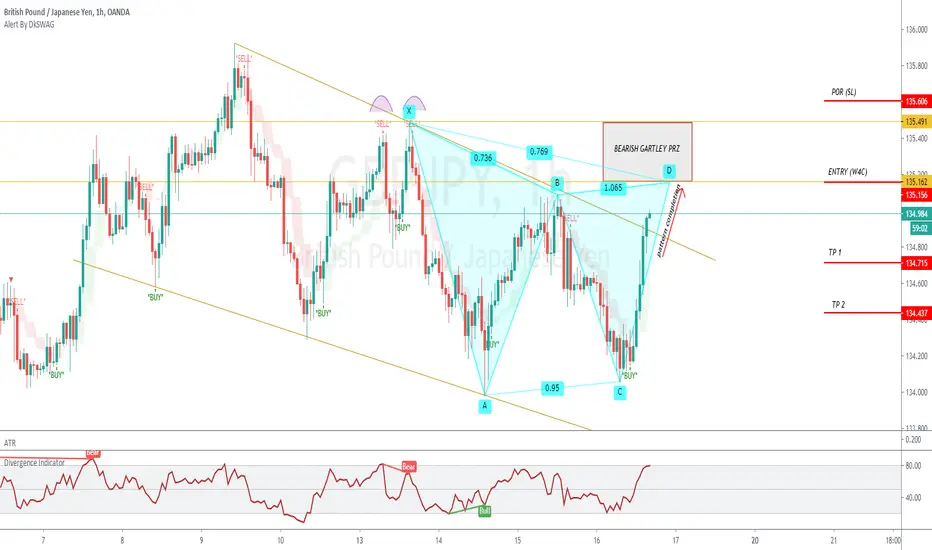
POTENTIAL SHORT (BEARISH GARTLEY APF) H1 TF POTENTIAL SHORT (BEARISH GARTLEY APF) H1 TF
*THIS PATTERN WILL VALID ONLY UPON COMPLETION OF THE PATTERN
*W4C IS THE BEST WAY TO ENTER
Abbreviations / Keywords:
LTF - Lower Time Frame
HTF - Higher Time Frame
TF - Time Frame
TRS - Trend Reversal Strategy
CRT - Counter-Retail Technique / Break-out
APF - Advance Pattern Formation
W4C - Waiting for Confirmation
LLCC - Lower low, lower close
HHHC - Higher high, higher close
SL - Stop loss
TP - Target Profit
POR - Point of Ruin
RRR - Risk Reward Ratio
Risk Disclaimer: This is not a trade signal hence we'll not be held responsible for any losses that will occur in your account during trading. You and you alone are responsible for deciding if you are comfortable accepting the potential risk involved in trading. So trade at your own risk and do not invest money you cannot afford to lose
EUR/USD goes down to the point 1.12500Hello traders. After the growth, the pair will correct to the level of 1.12500, then again a fast bull wave above the 1.15000
1.Pattern gives the way down
2.macd shows bearish
3.bearish divergence
4.Stochastic is oversold
Have a nice day and Profitable trading for all.
This is my personal opinion and NOT an instruction to act.

EURUSD-Weekly Market Analysis-Jul20,Wk2I'm waiting for shorting opportunity on EURUSD, is kind of a laser point focus for this pair. I've 2 trading opportunity right here for the setup. Shorting on the resistance line with a bearish engulfing candle and retest back to the resistance line to short or a Bearish Gartley Pattern setup with candle confirmation.

Is it too early to call on the Gartley Pattern?when there are many uncertainties in the market.. fibo patterns would popped up. Maybe the start of a new massive sell off of the cliff? anyway, this bear gartley could be the reason to enter the market if this played out like anticipated. TAYOR.

EURUSD-Weekly Market Analysis-Jul20,Wk1The Head and Shoulders formation has got us 145pips profit on the trade(link at the bottom).
Right now we are waiting for a Bearish Gartley pattern for a shorting opportunity.

NIFTY - GARTLEY NIFTY - GARTLEY
Nifty Hourly chart has bearish gartley formation with a prz zone @ 10130-10160
Now a decisive break above these levels, and open new levels on the upside . i.e 10300 and 10530.
However 10000 - 9970 can act as good support , if we see any correction from gartley prz.
Swing trade above 10180
Swing trade below 9950
New Range : 10160- 9970

EURUSD - Type2 Bearish Gartley A Type2 Bearish Gartley Pattern, any takers? If the next candle is a bearish engulfing I'll engage on a retest.

NZDJPY - Bearish GartleyA bearish Gartley setup within the consolidation zone, now the pattern has completed, I'm waiting for a retest to engage the trade.
Target2 will be an extended target.

EURUSD Shorting OpportunityThis pair have given us signs to SHORT it.
1. We created a Bearish Gartley Pattern
2. We broke and close previous Support Level
3. We broke and retested the trend line
4. We have created a downtrend
5. We are rejecting the 0.382 Retracement
We are expecting the market to at least test the 0.50 Retracement, before continuing it's move to the downside. If we do not reach it however, we would enter the market if this pair gives us a good entry reason.
NOTE: Do not place trades based on this analysis blindly, always have and follow your own analysis.
I would love to know your thoughts on this pair. :)

NZDJPY - Bearish GartleyA bearish Gartley Pattern form within the consolidation zone on the 1-hourly chart. On the daily chart, the bearish shark pattern has already formed.
So, how I'm going to take this trade? Well, shorting this pair will be the main focus, I will be waiting for a candlestick confirmation on the Gartley Pattern. If the market break and close above the consolidation zone(grey box), I will wait for the shorting opportunity on the daily chart instead.
Do you see that it is clearer right now? If you find this helpful, join our community by clicking the link at the bottom of my tradingview post, or your can just drop me a message.

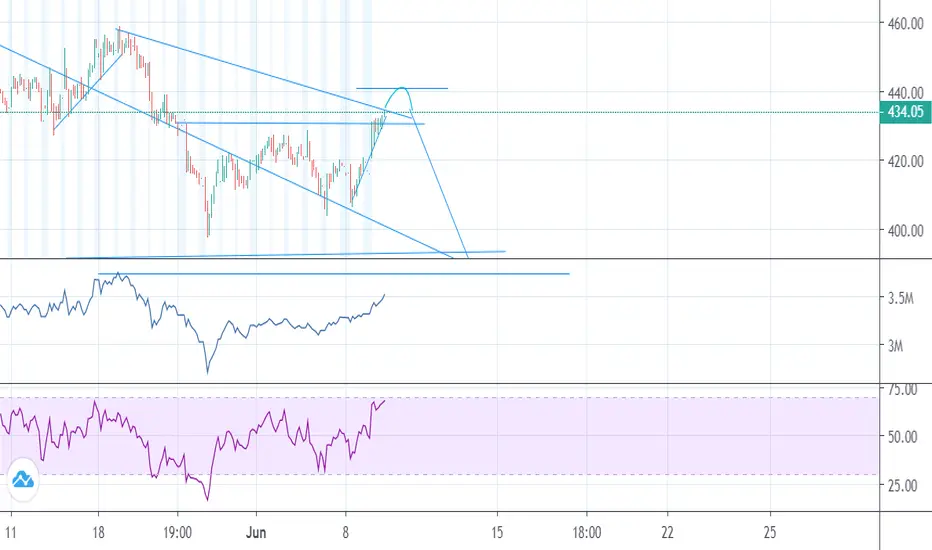
Netflix, short incoming 6/9/2020 Hello this is my graph anaylsis for NFLX
Predictions -
Stock should drop to should stablize around 415-420 imo.
Netflix will go to 440 at most, then it will drop.
OR - netflix will drop before hitting 440.
gl trading!
GOLD- GC1! - XAUUSD - M30 - Intraday Analysis - Gartley PatternGOLD- GC1! - XAUUSD - M30 - Intraday Analysis - Bearish Gartley Pattern
We are in a Major Bullish trend , but the price made a bearish reversal and we are now,
waiting for a pullback and expecting that the Bearish Gartley Harmonic Pattern is completed
@ the 0.618 Fibonacci Level to enter SHORT.
Our target will be the 0.236 Fibonacci level.
■■■■■■■■■■■■■■■■■■■■■■■■■■■■■■■■■■■■
Entry: 1702.50 | Stoploss: 1708.50 | Takeprofit: 1685.50 |
■■■■■■■■■■■■■■■■■■■■■■■■■■■■■■■■■■■■■
If you like this idea please click the like button to support us, thanks.
■■■■■■■■■■■■■■■■■■■■■■■■■■■■■■■■■■■■■
Disclaimer: All information and ideas provided is for educational purposes only. It is not a recommendation to buy or sell.
■■■■■■■■■■■■■■■■■■■■■■■■■■■■■■■■■■■■■

SHOP bearish englufing + possible bearish Gartley Looking for a break of the (B) to confirm Gartley for a move up to (D) to enter short. Add to the short on the blue trend line break, with PT 1 at first green line (.382) and PT 2 at the next green line (.618).


GBPUSD - H4 - Intraday Analysis - Bearish Gartley PatternGBPUSD - H4 - Intraday Analysis - Bearish Gartley - SHORT
We had a Double top Pattern on the H4 charts that has been confirmed with the bearish trend, but now we have a bullish reversal.
This bearish reversal could end now with the bearish greatly Pattern that is at a key Fibonacci retracement Level between 0.50 - 0.618
We enter short @ the Resistance zone.
Our first target will be the 0.382 Fibonacci Level and second target the 0.236 Fibonacci Level.
■■■■■■■■■■■■■■■■■■■■■■■■■■■■■■■■■■■■
Entry: 1.2385| Stoploss: 1.2435 | Takeprofit1: 1.2295 | Takeprofit2: 1.2210|
■■■■■■■■■■■■■■■■■■■■■■■■■■■■■■■■■■■■
■■■■■■■■■■■■■■■■■■■■■■■■■■■■■■■■■■■■
If you like this idea please click the like button to support this channel, thanks.
■■■■■■■■■■■■■■■■■■■■■■■■■■■■■■■■■■■■■
Disclaimer: All information and ideas provided is for educational purposes only. It is not a recommendation to buy or sell.
■■■■■■■■■■■■■■■■■■■■■■■■■■■■■■■■■■■■■

EURUSDDouble Top, Bearish Gartley, Bearish Wolf Wave and Stochastic RSI is in the overbought territory. Should there be downward pressure this week, it would be harsh.
