GBPJPY Bearish GartleyI will watch this on the 4hr chart and if we get close to the Dleg I will analyze SL and TP and go in on this one.
Bearish Gartley

AUDJPY Bearish GartleyI am looking closely at this to put a trade in. After last weeks chaos I will absolutely wait for the D leg to be met. This is one to watch!!!

Bearish GartleyBearish Gartley formation based on the Daily TF
Reversal off major half-point
Bearish engulfing confirmation on the Daily TF
Target 1 @ next quarter point
Target 2 @ next quarter point

Developing Patience in Order to Beat the Market!!Here we go again !! This time in the Aud /Chf ,this Bearish Gartley seems like the trade of the Month
(I know you're going to think "this guy went crazy') but we need patience to see if i am crazy or not !! :) :)

AUDJPY Gartley bearish at key resistanceA Gartley advance pattern trading setup is forming.
The D point would be at a key resistance level , market has a consolidated bias which favors pattern creation and confirmation. There is also AB=CD completion above Gartley's D point. The AB=CD pattern trading rules indicate the entry point few pips BELOW D. RSI and price action would be our guide but right now if market moves to that level short entries look inevitable considering the great risk/reward ratio.
Stay tuned
With regards,
Michail Sideris

EURCAD Bearish GartleyI feel like I may be pushing it on this one but I will be watching for validation before I short this one. I feel its worth keeping an eye on. I will update on Monday.

GBPNZD Gartley BearChatting with Tview user taylorplusdavis put my observation to the test.
A Bull Div (possible) for GBPNZD is actually a nice Bearish Gartley completed and ready for its next move down.
Enjoy
:D

EURAUD Gartley bearish pattern at previous highsGARTLEY BEARISH PATTERN
We have a pattern trading setup
Take profit targets and stop losses as in the chart

XAUUSD '222' Gartley bearish | RSI DivergenceWhat is the '222' Gartley? That advanced pattern in which AB=CD leg and D point is not exceed X.
So, we have a '222' bearish Gartley formation with RSI Divergence in 1 hour timeframe.

Bearish Gartley completion on EURGBP-price action moved to top of channel
-rsi divergence
-volume significant at resistance level
--> this idea is valid until a daily close above 0.8645

EUR/GBP Bearish Gartley Pattern in H4My view EUR/GBP Bearish Gartley Pattern in time frame H4. Please comment if my analysis not correctly.
Thanks

XAU/USD create Bearish Gartley Pattern in H4My other view XAU/USD Bearish Gartley Pattern in time frame H4 (in D1 XAU/USD create Bullish Three Drives Pattern).
This idea for target buy XAU/USD (D1) in fibo 1.618
Thanks

EUR/USD Bearish Gartley Pattern in D1Here my other view EUR/USD in time frame D1, on monday no news EUR, only news low & medium impact for USD.
Thanks :)

Bearish Gartley Formation On The Daily ChartPrice as recently pushed up into the entry zone (D Completion) to form this advanced gartley. looking to take 2 targets for this trade. once target 1 is hit I will be moving stops to break even.
will be a long trade so patience is the key


XAU/USD - Bearish GartleyThere are some amazing setups forming on the charts, here we have XAU/USD on the 4h chart with a bearish gartley.
The measurements for a valid gartley pattern are detailed below.
B: 0.618
C: 0.382 - 0.886
D: 1.272 - 1.618
Final X to D: 0.786
This is a potential outcome for this pair, I would analyse the higher timeframes for direction before entering the move.
If you want more trading inspiration be sure to connect with me on social media :)

Bearish Gartley Formation On 1Hour ChartHave a barish Gartley Formation on the 1 hour chart. looking for a D leg completion around the 0.85073 area. taking 2 profit targets. lets see if it pops!

USDCAD Bearish ButterflyUSDCAD 1 Day - Bearish Butterfly - 12/28/16<<>>05/02/2017
Legs A,B,C completed.
Leg D satisfied (BC 1.618) 2 days ago 1.37272
Leg D has room to play above 1.37272 some more but last nights action hit multiple walls 1.3746 candles.
Short Fib study (1.36499 - 1.37575)
.382 1.37164 - sustaining below is key 1st step down
.618 1.36910
.786 1.36729 - possible support at these levels but not confident market has reason to hold the range
Longer Fib Study (on chart):
.382 1.35541 - this is a significant price to break for large moves down

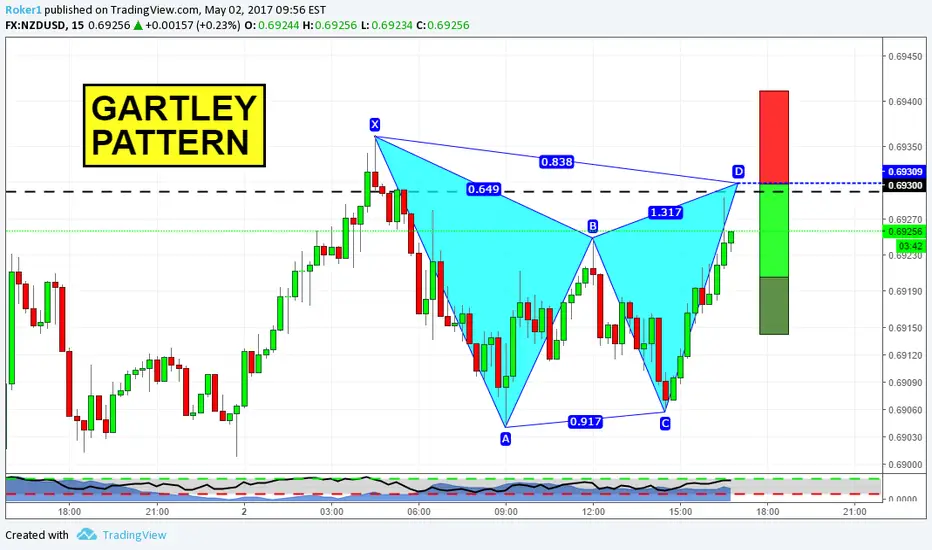
Day Trading with Harmonics!Hi guys,
here on the chart you can see 15m timeframe on NZDUSD. This Gartley lines up pretty well with a former structure level that could act as resistance now. Therefore, the likelihood of this trade is increased by that. Stops above X, targets as usual for harmonics.
If you have questions, or if you want to share your view, feel free to comment below.
Otherwise, see you in the next chart!
Advanced Gartey Pattern Formation 1 HourHave a possible bearish Gartley Pattern Forming on the 1 hour chart looking to go short at 1.09349 (may wait for more confirmation) and placing to order looking to take 1st and second extended targets

