BTC Log 08/22/2019Whats visible to me...
- Closest Resistance about 10200. Next Resistance at 10500
-Closest Support about 9700-9500 or 9100
-Bearish Pennant (Continuation Pattern). Or it could be a larger pattern currently developing.. which would give me the idea that its possible it stops at one of the green arrows and reverses shortly after. More PA is needed to evaluate.
- Failed Breakout
Planning my trade..
- Short term trade.
- Enter at confirmation of a breakout of the pattern.
- Plan for bullish and bearish scenario.
Bearish Pennant

BTC Crypto Market Cap Dominance - Decline in sightBTC dominance appears to be within a Bearish Pennant...
This is my current count here...
Also within a Rising Wedge...
5Day Bearish Divergence with Declining Volume at the top of the trend line...
I expect BTC to decline in dominance within the Crypto Market cap within weeks if not days.

$WKHS Bearish pennant set up and new lower target :($WKHS did not finish development of descending triangle pattern. In my view for the long term that would be a much better scenario. In that case, we would bounce really good of lower price and have an awesome rally. However, the price moved sideways forming bearish pennant and my outlook for $WKHS changed. I still would look for entry but at a lower level then I thought before and if we will follow this path, future development does not look as attractive as before.
Of course, there is always the possibility to breakout to the upside on any positive news but I would limit chances of that to about 25%. Stock still packed with scared money and before any significant move up we need to clear them out.
Moving average support more bearish idea. 9MA is about to cross 50MA. Price reached upper trendline of bearish pennant and 21MA and that is a very serious resistance that will be hard to breach without news.

Bearish Pennant on XPD/USD (Palladium) @ D1This bearish pennant formed on the XPD/USD @ D1 offers a bearish breakout opportunity. The pennant and its pole are marked with the yellow lines. My potential entry level is the cyan line. My potential take-profit level is the green line. The stop-loss level is already marked on the chart.

XRPUSD Impending Death Cross. What to expect:We can see here on h 1 day chart that the 1 day deathcross is imminent and will likely occur tomorrow or the day after at the latest. While at this point it does look like the initial cross will happen, My gut feeling based on fundamental developments and adoption in xrp, is that even if this initial cross does occur it will be short lived and proven a deathcross fakeout which will be reversed shortly there after back into a golden cross. Let's recall hat the beginning of the 2015 bull market for bitcoin began in a similar fashion where we got the 1st shortlived golden cross that then briefly went back into a deathcross before having it's real sustainable golden cross shortly later. I anticipate thee same kind of behavior this time around for xrp...however initially once this fake deathcross occurs price action could follow with it and we could see our current bearish descending triangle trigger a final capitulation breakdown and that triangle has a measured move down exactly to our super strong bottom support at 24.5 cents which is a good confluence point to skyrocket right back up at...however if the next breakdown that occurs is treating the current pattern more as a bearish pennant than a descending triangle then we could see a capitulation candle reach as low as 19-20 cents before the skyrocket back up. Lastly we could instead of a breakdown see an inverted bart pattern play out here in which case if it has a bullish enough impulse it's still possible we may avoid a deathcross altogether and instead see both moving averages bounce up off eachother. For something like that to occur at this point would require a green candle and bullish volume bar much larger than any we have seen for a long long time. All these things considered I think my wisest move here is going to be just wait for the break and if we dip down buy the dip at 28, 24.5, and again at 19-20 cens if we manage to make it that low. If worst case scenario price were to go under 16 cents at that point I may have to consider that the deathcross may not be a fakeout after all but that seems highly highly unlikely and low probability.

BTC continues showing bearish favor this weekA bearish pennant pattern appears on the BTCUSD chart, indicating that the pump and dump schemes in the recent days will end up with a flash crash to $8500 area, as mentioned in the last analysis.
Besides, BTC faces strong resistance of MA50 on the H4 timeframe (around $9800), there was a small chance of BTC to break this resistance on the first try. A decline of that resistance can push BTC back to $9100 area, and if that support can't hold, BTC will dump more.
The ideal short/sell zone is around $9800, with a stop-loss to be put at $10200. Targets for this trade are $9400, $9100, $8800, $8500.
Supports and resistance of BTC are posted in the last analysis below.

xrpusd deathcross looming? I anticipate a fakeoutimpending deathcross on xrp. while also in a 1 day bear pennant that has a target of 20 cents...i anticipate this deathcross will be a fakeout and we may see a inverted bart here instead of a bear pennant....however there's also a chance it could break down and the 50ma could briefly cross under the 200ma but if so in that case it would just be capitulation and price would rocket back up bringing a golden cross with it to signal a deathcross fakeout if capitulation happens i don't see it dropping the whole target of the bearflag I have a feeling the 28.5 or the 24.5 horizontal trendline would probably catch it before then...still worth being prepared to buy any kind of dip like that though should it occur.:

ETH shows bearish this week, its price will soon below $200Although having a small jump to $212, ETH still can not break the MA50 resistance on the H4 chart. In a downtrend market, we can't be optimistic with just a few dollars pumping like this.
In a bigger picture, ETH runs to the end of the bearish pennant pattern, it will break down this pattern by ~$60 to $160 area. ETH will follow BTC move in the next days.
A short order for ETH is recommended this time.

The death cross is still in play, and its awfully close to...The death cross is still in play, and its awfully close to the bearish estimated close of the bearish pennant pattern. looks bearish to me.


Bitcoin - #bearishpennant #pivot #supportEven though Bitcoin is forming a for now bearish pennant on a 30min timeframe, this does not necessarily have to break down due to the fact we have the Pivot support and a strong trendline support.
Going from here anything lower is considered very bearish mid-term and we could see as low as 4k (this would not invalidate the bullish reversal). There is also the possibility as we have seen before, we experience a rather unexpected
bart pattern, which is not quite unusual with former parabolic runs and an underlying fomo-mentality.

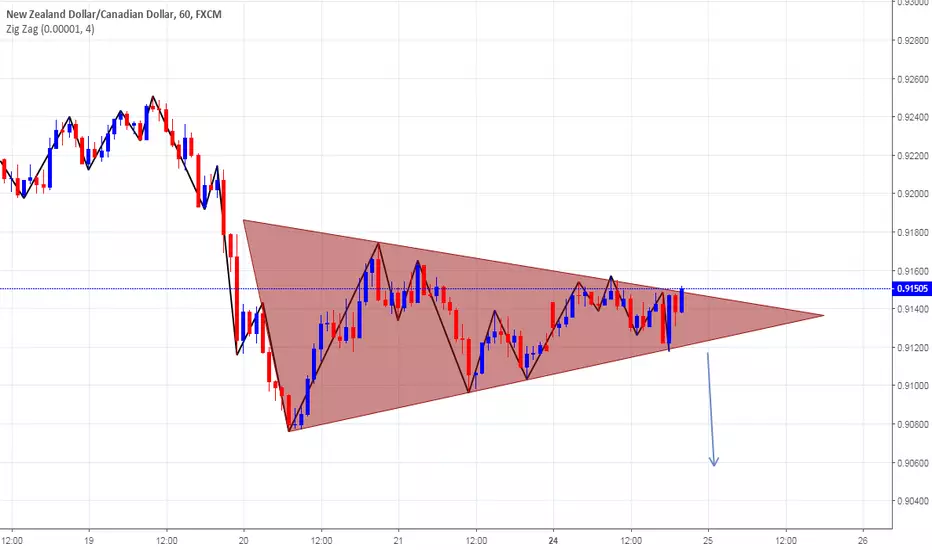
Short - Long term outlook - Bearish to BullishShort term the NZDUSD has created a bearish pennant formation - we could see the NZDUSD re-test the 0.6500 area
However, long term there is a bullish RSI divergence suggesting there could be some upside back towards the 0.6630 resistance level.
This will depend on the trade war/ RBA and RBNZ interest rate decision in the coming days

GBPUSD - bearish pennant A bearish pennant has seemed to form after a significant bearish move, this could be a sign of more to come. Looking at the chart now it looks like the price has entered a period of consolidation and would continue to move further down over the next day or two. The RSI has moved into a position to allow further bearish moves without being oversold. The price could move up, which is very unlikely, this would be possible if the price is able to break out the top of the pennant.


EURJPY Forcast shorterm correctionAs We know pennant pattern was break in H1, Potential correction until Fibo 61.8
EURJPY Short Selling
SL. 127.049
TP. 126.291
DisclaimerOn ;)
but enjoy the pips, Pros want to make money!
#MillenialTraders

BTC: Possible Bearish Continuation PatternBasic Trading 101
- Bearish pennants are continuation patterns that mark a pause in the movement of a price halfway through a strong downtrend.
- They occur just after a sharp drop in price and resemble a triangular flag as the price moves sideways, making gradually lower highs and higher lows.
- The downtrend then continues with another fall in price.
BTC seems to be forming a bearish pennant.
If Bitcoin breaks upwards from this pennant, we could expect the price to retest the 200 Exponential Moving Average.
If not, it could drop down the the blue area of the chart.
Looking at the 1 hour time-frame, we can see a bearish divergence on the RSI, indicating the possibility of a price drop to the lower line of the pennant, which would further indicate the validity of a Bearish Pennant.

BTC - LOW VOLUME RALLYThe volume behind this rally is not impressive. Ever since the break of 6k the volume has been declining, which suggests that the last several months of price action is consolidation before another big move. I am expecting another re-test of the descending trendline around $3850 to set a lower high before continuation of the prevailing trend.

Bitcoin Falling To 1850 ?!If The Price Falls Below 3380$ This Scenario Could Be Happen!
Be Careful & Use Stop-Loss For Your Trades.
Tp1: 2688$
Tp2: 1850$

btc seems to be consolidating inside a symmetrical bearpennantor maybe just a symmetrical triangle,,,I have brakdown targets for both the bear pennant or just the triangle limit buy is still set up for if we revisit the weekly 200 simple moving average.


BTCUSD HUGE BEAR PENNANT
BTCUSD is situated into this bearish pennant from 26 november 2018 until today and it most likely in late this month or february we will have a huge,massive and fast breakdown untill 1800-1900$. What is important to understand,i m not a permabear or permabull but this chart is extremly bearish
Beriash pennant is a continuation pattern and NOT a reversal pattern which means the price will likely to drop once again. Firstly,we dropped 51%,from november until today we are into a consolidation zone and soon we will continue to drop till this targets
Macd slowly want to go into the green zone but probably only these two line will touch each other and after will made a bearcross.Why? If will cross up we will going up hard which means REVERSAL but:
-We have a strong MA weekly resistance at 3758 and after at 4327
-Bearish pennant is a continuation pattern so we will drop
-RSI is above 30 so we have more room to drop
-MA bearcross in februrary at monthly timeframe(at the moment each MA at monthly is act as resistances so don t WAIT FOR 5K BECAUSE WE WILL NOT GOING TO 5K AT THE MOMENT
-MACD at monthly timeframe is too high,we need more correction untill we reach -0- neutral zone
-We can go till 43xx maximum but after we will going down(or will going up higher sub form of a peak and candle will close below resistance of bear penannt
-ETF Vaneckx will be rejected
-Bakkt will be delayed
No..i m not a permabear but we need MORE CORRECTION.After MA cross at 1 monthly timeframe i WILL BUY ALTCOINS
Hit Like/Follow if you want more charts/ educative materials!

BTC Possible Downside IncomingBTC has formed a bearish Pennant, a breakout to the downside is the most likely scenario here. The measured move would put BTC in the $2,200 to $2500 range.
