BTCUSD- An Evening Star: Bearish reversal pattern+double bottom4 HR chart
An evening Star: Bearish reversal pattern + double bottom . BTCUSD
Not financial advice. Trade with risk management
Bearishreversal

What do you know about Rising Wedges?Gold has broken the $1800 level and is now trading just above it.
This rising wedge occurred after a preceding downtrend which is going to act as a continuation of the preceding downtrend.
I would boldly state that the recent gains XAUUSD has been experiencing is a pullback to resume/continue the original downtrend.
If the high impact USD news (JOLTS JOB OPENINGS) being released is positive better than expected/positive, then my idea will be proved valid but until then, open sell limits with good risk & money management.
If you like this idea, leave a like, share your thoughts in the comment section and most of all, hording knowledge is bad, so share this idea with your fellow traders !.

AMC fully forcasted with Flat wave fic. retracement change added$286 ISH EP ON THE EXI.T TOP IS NON LOGARITHMIC WITH HISTORICAL ALGO PATTERNS AND OBVIOUS EWP LABELED. The Flat triangle wave that happens before the 5 th wave of a 5-3-5 Elliot combo wave with the retracement and support drop (due to the Instituional PLAIN manipipulation of the $SPX - bastardos) Exit 286 to be safe. Entry would be the first retracement - just follow the green ghost ppatterns Dont trade like a bull or bear- trade like a FOX

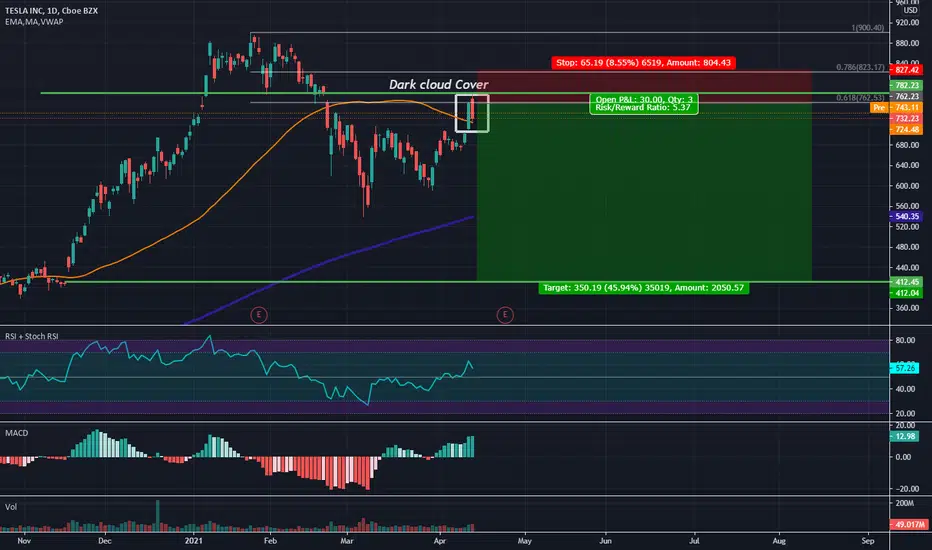
Bearish Dark Cloud Cover at a 0.618 Fib Retracement On the DailyYesterday TSLA went up to fill a gap before closing bearishly on the daily and ultimately forming a Dark Cloud Cover. This is a bearish signal that could take us down to fill some gaps on the downside, potentially going as low as $412; Any significant price action above the 0.786 retrace will negate this trade and any significant price action below the 55 Day Simple Moving Average will strengthen the validity of this trade.
$TRIP - Easy ShortPerfectly clear head and shoulders on $TRIP 's daily chart. Along with that there's a bearish RSI divergence & the fact that its run up SO much during a freaking pandemic, what a joke.


USDCAD Bearish Butterfly formed Anticipating for a bearish reversal here
entry placed at OTE and target pending orders advised and SL too

FCPO TRADING : 174) approaching critical level- 2800this is haidojo and the number is 174...
another drastic fall today...2900 has become a resistance level frm support...
so we are closing to the critical support 2800...see whether this support level hold or not...
IF it holds, price will slowly glide up frm here...IF lower-low is formed, a reversal is said to be formed...
higher resistance : 3030
immediate resistance : 2900
support : 2800
WARNING!
RISK DISCLAIMER : this is juz a trading idea...trading stocks, futures or forex might incur a huge risk to your account/funds… DON’T LOSE MONEY THAT YOU CANNOT AFFORD …any idea(s) of trading in this episode SHALL NOT be regarded as a hint of BUYING or SELLING . It is MERELY a trading journal and it has been used for educational purpose only… trade at your own risk!
**your "LIKE" and "FOLLOW" are my main source of motivation to continue posting more valuable contents...TQ**

Gold will attempt 1950 then DOWNHello everyone, just took a look at my charts i posted yesterday. Everything was aligned perfectly with my calls. What I’m seeing next is that gold will retest 1950 then have a correction to 1920. Prepare your pockets for bull run to 2100 😍

2 of 3 Candlestick Patterns That Pinpoint ReversalsBearish Hammer Candlestick (AKA Inverted Hammer)
These bearish formations are simply upside down hammers, and are also known as inverted hammers.
Here's what a bearish hammer candlestick is telling us:
Price opened near the lows of the candle, and although buyers initially succeeded at pushing price higher, they lost the final battle when sellers tipped the scales in their favor again by closing price lower than the opening price.

EURJPY 15M ASIAN SESSION BEARISH REVERSALBearish Reversal Candlestick
The inverse is true with this type of formation in a bearish scenario, and the image above shows that price made the highest high before reversing and closing strongly lower off its highs.
Here's what a bearish candlestick is telling us:
Price made a new high, but buying pressure very quickly dried up as an increase of sellers entered the market resulting in the candle closing lower off its highs, signaling selling strength.
Strategy Provided by Price Action & Income by Richard Krugel

bearish reversal divergence-Jindal steel and powerJindal steel making clear higher highs but Macd is making a lower low indicating a further fall in price.
one can sell @cmp with SL@157.5
R:R would be 1.8
target -148.5

CL1! - Crude Oil - WTI - H1 - Weekly Analysis - SHORTCL1! - Crude Oil - WTI - H1 - Weekly Analysis - SHORT
We have a Major bullish Trend on the Daily chart , but we a bearish reversal since the price is below 37.50$.
We are waiting for a little pullback on a key level to enter SHORT between the golden zone to enter Short.
Our target will be the @ -0.382 Fibonacci Level.
■■■■■■■■■■■■■■■■■■■■■■■■■■■■■■■■■■■■
■■■■■■■■■■■■■■■■■■■■■■■■■■■■■■■■■■■■
If you like this idea please click the like button to support this channel, thanks.
■■■■■■■■■■■■■■■■■■■■■■■■■■■■■■■■■■■■■
Disclaimer: All information and ideas provided is for educational purposes only. It is not a recommendation to buy or sell.
■■■■■■■■■■■■■■■■■■■■■■■■■■■■■■■■■■■■■

NASDAQ - US100 - NQ1! - H1 - Intraday Analysis - SHORTNASDAQ - US100 - NQ1! - H1 - Intraday Analysis - SHORT
We have a Major bullish Trend on the Daily chart , but we just had a bearish reversal pattern.
We are waiting for a little pullback on a key level to enter SHORT.
■■■■■■■■■■■■■■■■■■■■■■■■■■■■■■■■■■■■
Entry: 9630.00 | Stoploss: 9710.00 | Takeprofit1: 9430.00 | Takeprofit2: 9260.00 |
■■■■■■■■■■■■■■■■■■■■■■■■■■■■■■■■■■■■
■■■■■■■■■■■■■■■■■■■■■■■■■■■■■■■■■■■■
If you like this idea please click the like button to support this channel, thanks.
■■■■■■■■■■■■■■■■■■■■■■■■■■■■■■■■■■■■■
Disclaimer: All information and ideas provided is for educational purposes only. It is not a recommendation to buy or sell.
■■■■■■■■■■■■■■■■■■■■■■■■■■■■■■■■■■■■■

EURGBP-Head & Shoulder Short Opportunity175 pip potential trade on OANDA:EURGBP .
Enter short on neckline break.

Final push for the bulls? or just a reversal?Welcome to my market daily update:
• Daily: I don’t like how the daily RSI isn’t resting, many of you know how I love the OBV indicator, it is a very hard tool to expert it and I have my own way to confirm with it if we are in a bull run or not (Among other confirmations to support it which you must have), and as you can see in the daily chart:
most of the green arrows which confirming the last 2 bull runs for me (After confirming these with other aspects as well), are actually working out but with 2 exceptions (Yellow marks) due to RSI (Every time we have RSI overbought, it has a sudden pull out to give oscillators time to rest before the next move):
1. RSI didn’t rest, but it was during a confirmed strong bull run – it means buyers can easily continue buying and suppressing higher “over bought” areas, usually this break TA with over excitement, this
should be a warning sign as well that we are getting to the peak if this happens during a parabolic bull run.
2. RSI didn’t rest, but it was during a confirmed bear run – it means that there is a lot of activity from the bulls and that the speculations and excitement are too high because of an incoming event.
- This is just my own speculation as I’ve seen it in the past as well, this doesn’t mean that this is what will happen, because in overall the midterm market is extremely bullish which might lead to breaking
the big-term bearish market and start the next bull run (We ju, I personally don’t trade against the bigger picture trend unless I confirm that it is changed, so I prefer to stay bearish.
- But to our community we prefer the smarter way which is stay bullish trades as we are less focused on mid-term reversals, we prefer to focus on the strong mid-term trend as this gives the best results
and not counting on speculations if the overall market trend is changing or not.
______________________________________________________________________
• Weekly: 5 more days for halving, I expect next weekly to decide if to break this, we never ever had more then 8 weekly green candles, so are we getting ready for a final push this 8th week or are we going to heavily reject it? if we aren’t going to break above 9335 until weekend then I expect that we won’t see a 9th green candle and expect us to correct to at-least 8,300 because our next move, breaking below it will bring us to 7575, and going below it I suspect will continue the bearish channel which we’ve been riding for almost a whole year already since 14k, and if this happens then the halving effects will easily start the bull run in next 5-7 months like I keep repeating myself… I wish for the bulls to push harder and finish it up, but as they are exhausted and as we are right under the top channel, I won’t be surprised.
- Do notice that we are still inside the weekly cloud as well, which acts as a very heavy resistance for us
- And also notice that our weekly PA candle forming a hanging man candle – it means we might have ended our run as well as when it appears at peak of bullish move then reversal is the logical next move
• As I posted on my TG:
- “Im heavily shorted the market since 9300 on my trading portfolio (big bet), also I sold a lot of my long term portfolio assets, I really think this was the top on Crypto, if Im wrong I dont lose much as per
to my portfolio management and all I will feel is just missed out move, but if Im right this is going to be a very big jump for me. I will say this, we still decided to go long for our community as we prefer to
follow the midterm trend, but as I have been saying since I came back, just notice that the big term mood since 14k is still bearish, and smallterm vibe is showing a strong weakness from many aspects, so
Im staying with my risky bet..” – so I don’t mind if we fall 😉, as I usually trade for the bigger moves. But priority for our group is of-course bullish.

Ethereum shows a bearish reversal at the daily...!Not very bullish as you might know. Keep an eye on it and let see how this plays out...!

Santen at Top of TrendSitting at the top of the upward trend, short term bearish reversal possible. Overall however looks really bullish.

Bearish Pattern coming in 9/20/19*** Disclaimer - This is my first published prediction. I've only been studying charts for about 4 months, so I wouldn't put much weight to this. Oh, this is not trading advice. Do not use this as a strategy. ***
With the political climate coupled to sound recession indicators alarming and a correction to the job growth data for the year, I think a Head and Shoulders pattern was just formed. The accuracy of a head and shoulder's pattern in predicting a bullish to bearish reversal is *supposedly* quite accurate. With the trading for the week closed out for the day, this loss would be a confirmation of a reversal for the right shoulder (also making it an evening star pattern).
I can foresee variability in the pattern due to artificial stimuli (tweets) boosting the market if occurring in tandem in the latter part of next week.
Hope no one loses their revenue streams at a time when working for a living is no longer an option.
Best wishes.
M

SPY Rising Wedge FormingIf SPY successfully moves higher to the top of the wedge , this pattern will be confirmed while putting in bearish divergence in the PPO and RSI (RSI not shown but it is there as well). Be ready for a minimum drop back to the August price range support.

EUR/USD A Bearish Reversal Signal?
Over the past few days, we have seen that EUR/USD have broken the few months long bearish trend line and thus indicating that the sellers are unable to push the EUR against the USD lower and that buyers are once again back. Hence, we can see that the selling pressure is disappearing, whereas buying pressure is heating up. Thus, target price can be drawn to 1.14500 where potential profit taking might take place again.


AUDUSD looking down !Hello,
After a short uptrend, AUDUSD reversed with a bearish divergence.
This divergence is corrected now, but the pair gained a bearish momentum. I expect a stronger reversal. (Short time EMA are about to cross)
For this trade we will use the previous high as a stop (if broken, it will mean the uptrend continues).
SELL : Now
BUY : Blue zone (0.695 level)
STOP : 0.716
Risk/reward : 3
Trade safe, manage your risks.
