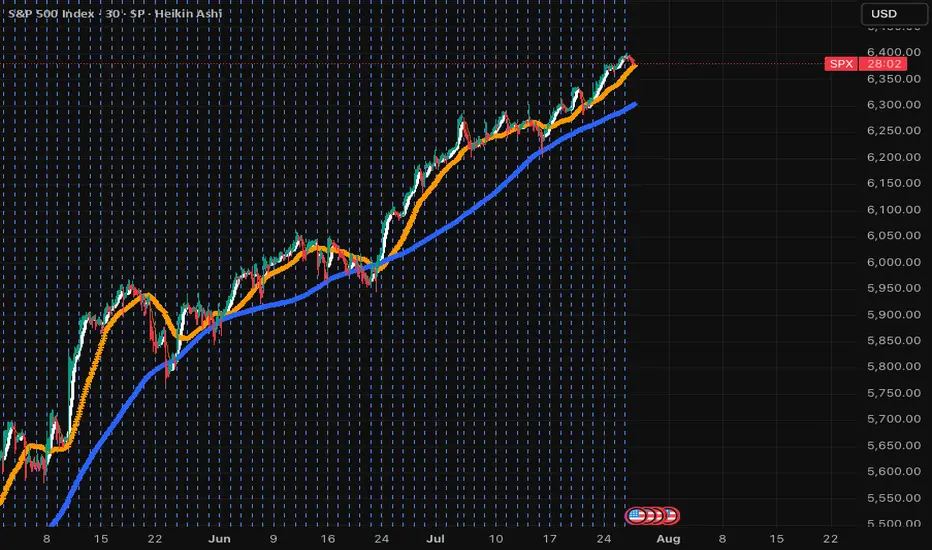
SPX....what goes up, must go downThis is long overdue. SPX has just crossed 9SMA, next 50SMA then 200SMA. Won't be surprised if it knocks each very soon. This will be a big week and tariffs are going to start hitting; even though this was mostly artificial and Americans are paying 90% of it! When in doubt, sell and park in money market! The next dip will hit hard and deep. Don't let the small wins overshadow the deep issues in the economy. Overpriced market and many lagging indicators will soon hit and default rates that are coming out are scary! Stay safe and don't get emotional over any stock. If it dips, you can always buy it cheaper.
Bearishsetup
XRP/USD – Bearish Shift After Momentum Exhaustion🧠 Summary:
XRP/USD has shown clear signs of exhaustion after sweeping the previous high. Following a breakout from a daily bull flag, price struggled to hold momentum near the key level of 3.4194, forming an ascending channel that eventually broke down. Liquidity zones below current price are now in focus.
🔍 Technical Breakdown:
✅ Daily Bull Flag → Broke out with strength
⚠️ Rejection near Previous High (3.4194) → No follow-through
🔼 Ascending Channel → Formed post-impulse, now broken
📉 Momentum Shift → Structure flipped bearish
💧 Liquidity Zones (LQZ) below price acting as magnets
📌 Key Levels:
🔹 Last High: 3.4194 (Rejection Point)
🔹 Broken LQZ: 3.2868
🔹 Current Support: 3.1689 (LQZ - being tested)
🔹 Target 1: 2.9849 (4HR Liquidity Zone)
🔹 Target 2: 2.7667 (Daily Liquidity Zone)
🧩 Confluences:
Liquidity sweep of prior high
Momentum loss near key resistance
Break of ascending structure
Retesting broken zones with room below
⚠️ Final Thoughts:
This trade is playing out just as we described in the post before this on XRP. We discussed watching how price would react to this area before making any type of "Late Entries". XRP is still a huge and vital part of the Crypto Eco System so long term i am holding my Long position. The areas on the chart are still great areas to buy in at "Dollar Cost Average". This will be one of those positions that though it may be bearish on the lower time frame you need to zoom out and always keep an eye on the weekly and daily chart before making any drastic moves.

XAUUSD- Bearish AB=CD pattern at resistance zone!Timeframe:2H|Pattern: AB=CD| Bias: Bearish Reversal!
Gold (XAUUSD) has completed a precise AB=CD pattern aligning perfectly with a strong resistance zone near 3340-3350 the symmetry of the harmonic pattern combined with historical rejection levels gives a strong signal for a potential downside move
Trade setup idea:
Sell entry: 3340-3350
target:1: 3300
target:2: 3260
risk reward: Favorable setup with harmonic confirmation.

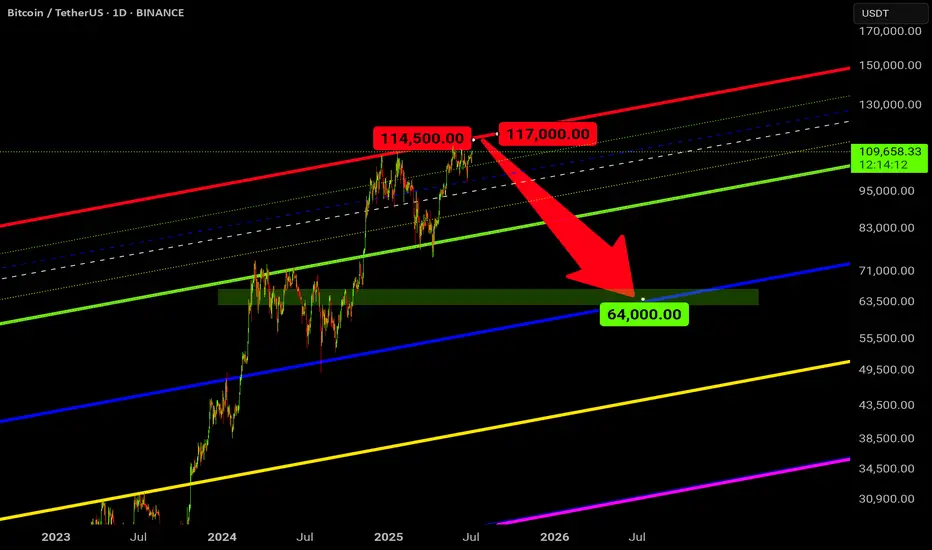
BTC Sell ShortThis is how I see Bitcoin in a year's time : the beginning of a bear market and the end of a bull market .
XAUUSD Bearish Setup | Support Levels in SightGold has broken down from the ascending channel, indicating a potential shift in market structure toward bearish momentum.
🔎 Technical Highlights:
Clear breakdown from the ascending channel
Price currently facing resistance near $3,323
Two key support zones:
🟩 First Support: $3,295 – potential bounce area
🟩 Second Support: $3,258 – deeper downside target
📊 Short-Term Outlook: Expecting a minor pullback before continuation lower toward the $3,295 support. If that level fails to hold, the next target becomes $3,258.
💡 Trade Idea: Watch for rejection below $3,323 for a possible short opportunity targeting $3,295 and $3,258. Keep an eye on momentum and volume.
🔔 Note: Always use proper risk management. This setup is based on current price action and may change with market dynamics.

EURUSD Technical Breakdown | Bearish Reversal Ahead?The Euro is showing signs of a potential major trend reversal after completing a strong rally within an ascending channel.
🔎 Chart Analysis:
Price surged out of a long consolidation range and followed a parabolic curve.
The pair reached the upper boundary of the ascending channel and started stalling.
Early signs of a distribution phase are visible, hinting at possible downside momentum.
📉 Bearish Scenario In Play:
A break below 1.1600 could accelerate the sell-off.
Key support zone at 1.14526 — potential first reaction level.
If momentum continues, next major support rests at 1.12329.
Short-Term Outlook:
Watch for breakdown confirmation below the channel.
Risk management is key; consider short entries on bearish candle confirmation.
💬 What’s your view? Are the bears finally taking over EUR/USD? Drop your thoughts below! 👇
#EURUSD #Forex #TechnicalAnalysis #PriceAction

BTCUSD Analysis | Bearish Setup Unfolding?Bitcoin is trading within a descending channel, respecting lower highs and lower lows. The recent price action shows a sharp bounce from the $98,600 support zone, but the bigger picture still hints at potential downside.
🔍 Key Technical Insights:
Descending Channel remains intact – structure suggests bearish continuation.
Price bounced from $98,626 support, but is struggling below key resistance at $108,622.
A possible lower high formation near $106K–$107K could trigger the next drop.
Bearish projection remains valid if price fails to break above the descending trendline.
🟢 Upside Scenario: If bulls manage to break above $109K resistance, we could see a bullish reversal.
🔴 Downside Target: If the bearish setup confirms, we may revisit the $98,000–$99,000 support area once again.
📌 Plan Accordingly:
Wait for price action confirmation near resistance. Patience pays in volatile zones like this!
#BTCUSD #Bitcoin #CryptoAnalysis #TradingView #BTCUpdate #CryptoTrader #TechnicalAnalysis

GBPUSD Price Action Analysis | Sell Setup Below 1.36106In this GBPUSD market overview, we break down recent price action following yesterday’s strong bullish rally from the momentum low. The session was highly emotional across major forex pairs, which is typical when a major wave structure reaches its end. This often results from incomplete auctions on one side of the market, causing order flow imbalances that drive sharp price movements.
The key price level we're watching on GBPUSD is 1.36326. Price approached this zone with momentum, and the rejection at 1.36267 triggered a classic TCP (Trend Changing Pattern), followed by a single upside break, confirming exhaustion at the highs.
📉 Sell Setup:
According to the Waves of Success execution model, the best short entry is below 1.36106, in alignment with the prevailing bearish structure.
⚠️ Alternative Scenario:
We are not looking for long setups on GBPUSD at this time — our bias remains bearish unless significant structure changes occur.
This analysis combines wave structure, trend confirmation patterns, and institutional price levels for a professional, risk-managed approach.
🔑 Key Levels:
Resistance: 1.36326
Rejection High: 1.36267
Sell Trigger: 1.36106

XAUUSD Price Analysis | Bearish Reversal in ProgressGold has sharply broken down from the upper boundary of a well-respected parallel channel, hinting at a potential trend reversal.
🔎 Technical Breakdown:
Strong rejection at ~$3,440 resistance zone
Break in market structure = early signs of bearish momentum
Support 1: $3,300 – key short-term zone
Support 2: $3,250 – major confluence level
If price fails to hold above $3,300, a continuation toward $3,250 looks likely in the coming sessions.
📊 Trade Setup
Bias: Bearish
Entry Zone: On pullbacks below $3,390
TP1: $3,300
TP2: $3,250
SL: Above $3,420 (recent swing high)
⚠ Watchlist Dates:
🗓 June 18 – FOMC Meeting (high impact)
💬 What’s your outlook? Will gold hold $3,300 or are bears in control? Let’s discuss below!
#Gold #XAUUSD #PriceAction #TradingView #TechnicalAnalysis #Forex #FOMC #MarketOutlook

EURCAD Bearish Setup | Trend Reversal Incoming?The EUR/CAD pair has been respecting a parallel ascending channel, with price recently touching the upper boundary and now showing signs of a potential sharp reversal.
🔹 Key Technical Observations:
Price broke out of a long consolidation zone (early June), followed by a strong bullish impulse.
Currently rejecting the upper boundary of the parallel channel, suggesting bullish exhaustion.
Bearish projection aims for a potential drop toward the 1.55400 support zone, aligning with channel midline or lower boundary.
📊 Trade Idea:
Watch for confirmation of rejection (bearish engulfing / break of minor support).
Short entries can be considered on break below intraday structure.
Target Zone: 1.55400
Invalidation: Clean break and close above 1.58500
⚠ Always manage risk and confirm with your trading strategy.

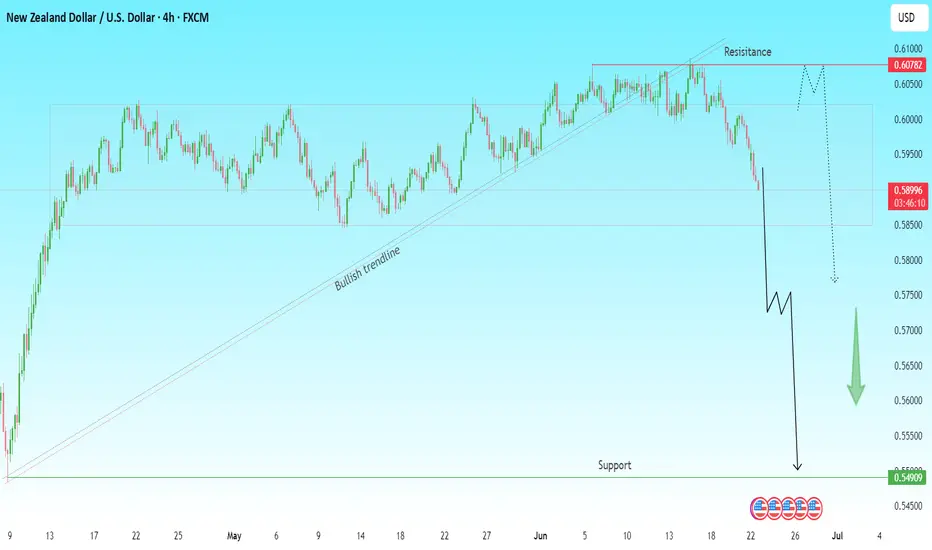
NZDUSD Breakout Alert | Bearish Wave Incoming?The bullish trendline that supported NZD/USD for over a month has finally been broken decisively, signaling a potential bearish reversal.
🔍 Technical Breakdown:
Price has rejected strong resistance around 0.6078 – 0.6100
Clean breakdown below the bullish trendline support
Market structure shift confirmed on the 4H chart
Bearish momentum is gaining strength with no signs of slowdown
📊 Bearish Scenario:
Expecting a minor pullback toward 0.5950–0.5980 zone (potential retest)
If resistance holds, likely continuation toward major support at 0.5490
✅ Trade Idea:
📍 Sell on pullback below 0.5980–0.6000 zone
🎯 Target: 0.5700 → 0.5550 → 0.5490
❌ SL above 0.6100
🔔 Watch closely for price action confirmation before committing – momentum is key.
#NZDUSD #ForexAnalysis #Breakdown #TrendReversal #TechnicalAnalysis #BearishSetup #TradingView #PriceAction
Shoulder on Shoulder - Need a dump this Week😥 The past week was complicated, and I don't want to bore you with all the political goings-on, which I hope you're already aware of. I'm a bit short on time right now, but I still wanted to share this perspective with you all.
💁♂️ It is Shoulder on Shoulder H&S everywhere!
💡 My concept of a plan:
🧗 Let's climb the Pinky way down
3289 - Actual Price
3271 - 🏁 S1
3232 - 🚪 Pink Neckline entry
3245 - 🤞 S2 & Head of White reverse H&S
3204 - 👀 Pink Start from Left Shoulder
3184 - 🎯 TP 1 - Fibo 1.272
3163 - 🎯 TP 2 - Fibo 1.414 or 3166
3134 - 🎯 TP 3 - Fibo 1.618 or 3154
3120 - 👀 Head of Yellow reverse H&S
3079 - 🎯 TP 4 - Fibo 2
🗣️ Important: FED Chair Powell speaking June 02 Mon at 1 PM EDT
What are your toughts about this? Please write it in the comments.
-------------------------------------------------------------------------
This is just my personal market idea and not financial advice! 📢 Trading gold and other financial instruments carries risks – only invest what you can afford to lose. Always do your own analysis, use solid risk management, and trade responsibly.
Good luck and safe trading! 🚀📊

EURUSD - Short Opportunity Ahead EURUSD is currently approaching a key resistance level after a strong upward move. Price action is showing signs of exhaustion, and bearish signals are beginning to emerge. If the pair fails to break above the resistance and confirms a rejection, we may see a short-term pullback or a potential trend reversal.
A clean break below the recent support zone could provide a short opportunity, with possible downside targets near previous lows. As always, proper risk management is essential, especially in high-volatility conditions.
---
Key Technical Points:
Price nearing a strong resistance zone
Bearish candlestick formation / divergence (if applicable)
Wait for confirmation before entering a short position
🔒 This is a trade idea for educational purposes only — not financial advice.

BTCUSD Bear Trap Loading – Premium OB Sell Setup ActivatedBTCUSD | 1H Smart Money Rejection Play – Premium Repricing Before Breakdown
The king of crypto is looking shaky. Smart money isn’t buying the pump. Here’s why BTCUSD might be gearing up for a steep dump from a premium order block reaction 🩸👇
📌 1. Market Context:
After a clean bearish leg, BTCUSD is now retracing into a premium zone — above the 70.5% Fib
Price is climbing into a high-probability reversal OB (highlighted in purple/red)
This area aligns with the 70.5%–79% golden retracement zone — where institutions love to load shorts 🧠📉
💎 2. Key Levels to Watch:
🔺 Premium OB Zone (Sell Zone): 108,378.95 – 109,276.15
🟣 Golden Rejection Zone: Fib 70.5% – 79%
🔽 Target Weak Low: 103,121.59
⛔ Invalidation/SL Above: 109,276.15
🎯 RR Potential: 1:4+ sniper-grade
Price is expected to tap this premium zone, sweep liquidity, and collapse into the weak low for a full market cycle completion 🔁
🧠 3. Smart Money Flow:
This move smells like a liquidity grab trap – taking out late longs before a drop
No bullish BOS from HTF – market structure still bearish
OB overlaps with inefficiency (FVG), making it ripe for rejection
Strong high is intact — unbroken = more confluence for downside
🎯 4. Execution Strategy (Entry Tips):
⚔ Wait for:
M5–M15 shift in structure (BOS) from bullish to bearish inside the OB
Sharp rejection wick or engulfing candle for confirmation
Ideal entry = wick entry near 109.2 with tight SL just above OB
Target = weak low for full mitigation and profit harvesting
This is surgical precision territory. The sniper must be patient before pulling the trigger 🥷
🔥 5. Why This Short is GOLD:
✅ OB + Fib + FVG confluence = high-odds reversal zone
✅ Price is in premium – not discount = perfect for shorts
✅ Weak low = magnet
✅ No bullish confirmation = no reason to long
This is not a guess — this is the blueprint for institutional execution 📐
📉 Drop “BTC Dump Mode 🚨” in the comments if you’re watching this setup too
🔁 Save this setup for your playbook
⚔ Follow @ChartNinjas88 for more institutional-level trade ideas like this one

GBPUSD Bearish Setup | Trend Reversal Setup in Progress...📉 Technical Outlook _
After a strong bullish rally within a parallel ascending channel, GBP/USD is now showing signs of potential reversal. Price action recently broke out of the channel and is failing to reclaim upward momentum, indicating that buyers may be losing control.
🔍 Key Observations:
🟪 Previous Consolidation led to the breakout
📈 Strong bullish structure inside the parallel channel
❌ Price has now exited the channel, with clear signs of rejection near 1.347x
📉 Bearish pattern projecting a potential drop to the support zone at 1.31521
⚠ Watch for This Bearish Scenario:
1. Liquidity grab or false breakout above short-term highs
2. Strong sell-off as momentum fades
3. Clean bearish continuation pattern toward 1.3150 support
✅ Bearish Confluences:
Breakdown from parallel channel
Series of lower highs forming
Weak recovery attempts
Clear downside target with prior support zone structure
🔷 Note: Keep an eye on macro news and USD strength before executing. This is a technical setup with potential, not a guarantee.
📊 What’s your bias? Bullish or Bearish? 👍 Like & 🔔 Follow for more technical setups!

XAUUSD Bearish Breakdown| Trend Reversal Bearish Setup Price has broken below the rising channel, showing early signs of a potential bearish reversal.
Key Resistance: 3364
Current Price: 3334
Support Levels to Watch:
3282 (first support)
3250 (major target)
If price fails to reclaim the channel and retests 3364 without strength, we could see a deeper drop below 3282. A bounce from 3282 might offer short-term buy setups, but momentum favors bears for now.
Trade Plan:
Short below 3325 with SL above 3364
Target: 3282, extended to 3250
Let me know your thoughts! Are you bullish or bearish here?
#technicalanalysis #priceaction #tradingview #USD #bearishsetup

#COOKIEUSDT maintains bearish momentum📉 SHORT BYBIT:COOKIEUSDT.P from $0.2787
🛡 Stop loss: $0.2925
🕒 Timeframe: 4H
✅ Market Overview:
➡️ A Rising Wedge pattern has formed and broken down, confirming bearish momentum.
➡️ Price has broken below the wedge and the POC level at $0.2976, turning it into resistance.
➡️ Strong volume cluster at $0.2976–$0.2925 is now likely to act as a rejection zone.
➡️ Bearish pressure is visible through high-volume red candles.
➡️ Arrows on the chart indicate a continuation toward the take-profit levels.
🎯 TP Targets:
💎 TP 1: $0.2660
💎 TP 2: $0.2515
💎 TP 3: $0.2395
📢 Watch how price reacts BYBIT:COOKIEUSDT.P to TP1 — weak bounce may signal room for deeper drop.
🚀 BYBIT:COOKIEUSDT.P maintains bearish momentum — further downside expected!

Gold (XAU/USD) Technical Analysis – Rising Wedge Breakdown & MMC🧠 2. Introduction to Mirror Market Concepts (MMC):
MMC, or Mirror Market Concepts, is a powerful technique that views price action as symmetrical or repetitive in nature. In this scenario, we notice that the right side of the chart mirrors the left — suggesting that after this bullish climb, the market might repeat its earlier bearish behavior but in a reflected pattern.
This adds confluence to our bearish outlook and makes the forecast more robust.
🔺 3. Rising Wedge Pattern – Bearish Reversal Signal:
The most critical part of this analysis is the formation of a Rising Wedge — a classic reversal pattern. Let’s break down what it means:
Structure: The wedge is formed by two upward-sloping trendlines converging at the top.
Volume Behavior: Volume typically decreases as the wedge matures, showing that bulls are losing strength.
Psychology: Buyers keep pushing the price higher, but each move has less momentum than the last. Sellers are quietly preparing for a breakdown.
The moment price breaks below the wedge’s lower trendline, it usually triggers panic selling or aggressive short entries.
🔄 4. Key Price Levels & Zones:
Minor Resistance Zone: Price rejected near a historical resistance area, showing sellers are still active.
Previous Target Zone: This area acted as a ceiling before the rejection — important for reversal confirmation.
SR Interchange Zone: A classic zone where support becomes resistance — this adds strong confluence to the reversal idea.
🎯 Bearish Trade Plan & Take-Profit Levels:
Once the wedge breaks down, the projected move is based on measured moves and prior support levels. Here’s the breakdown:
✅ TP1 (Take Profit 1): 3,275.30 – This is the first key support level right after the wedge breakdown. Ideal for partial profits.
✅ TP2: 3,205.64 – Previous support zone from earlier consolidation. High probability target.
✅ TP3: 3,169.18 – A more extended target that aligns with historical price memory and full wedge depth.
Each TP level is supported by historical price structure and previous volume clusters.
⚠️ Risk Factors & Trade Management:
While this setup looks strong, always consider:
False Breakouts : Wedges can fake out traders. Wait for candle close confirmation below the wedge.
News Events : Macroeconomic announcements (especially U.S. dollar data) can reverse technical setups.
Risk-to-Reward: Don’t enter without calculating your stop loss above the wedge and aiming for at least a 1:2 ratio.
🧠 Conclusion – What This Setup Tells Us:
This chart is a perfect blend of price action + market symmetry (MMC). The rising wedge signals that bulls are running out of steam, while MMC suggests a mirrored decline could follow.
If price action confirms the breakdown with momentum and volume, this could be a high-probability short setup for swing traders and intraday players alike.

ETH Trap & Drop Setup – OB Rejection + Bearish Channel📉 Ethereum (ETHUSD) | 1H SMC Breakdown | Bearish Setup Explained
Another clean setup for the SMC gang. ETH just gave us a beautiful opportunity, respecting market structure, reacting to Order Block supply, and aiming to clean up sell-side liquidity. Let’s dive in 👇
🧱 1. Structure: Bearish Channel Formation
ETH has been moving in a tight bearish channel, producing:
Lower highs (confirmed supply zones)
Lower lows (liquidity grabs + structure breaks)
This shows consistent bearish pressure.
🧊 2. Premium OB Tap + Rejection Zone
Price just retraced into a Bearish Order Block sitting in the Premium zone, right around $2,514.
💥 OB zone is aligned with:
Upper channel resistance
Supply rejection
Clean inefficiency fill
Price wicked inside and immediately rejected = Smart Money active.
🧠 3. Retail Psychology Trap
Retail likely:
Longing support bounce
Placing stops under structure lows
Not respecting OB/imbalance narrative
Meanwhile, Smart Money:
Enters short from OB
Targets imbalanced zones
Eyes the $2,270 weak low
🎯 4. Liquidity Pool & Final Target
🔻 Target Zone: $2,270
This level is:
A weak low (high chance of being swept)
Sits at lower channel boundary
Acts as a liquidity magnet
Expect price to accelerate as it approaches this zone.
⚔️ 5. Trade Plan (Short Setup)
📍 Entry: $2,514 OB Zone
🔐 Stop Loss: Above $2,582 (structure break + OB invalidation)
🎯 Targets:
TP1: $2,460
TP2: $2,400
TP3: $2,270
⚖️ RRR: ~1:4+ – high precision trade
🧠 Key Concepts in Play:
Order Block Rejection
Premium Pricing Sell Setup
Bearish Channel Continuation
Liquidity Sweep Targeting
📌 Chart Summary:
"Don’t chase candles – follow the narrative. OB tells the story, liquidity gives the profit."
📚 Study the OB zone reaction. These setups repeat every week across assets if you know what to look for.
💬 Drop “ETH OB SNIPER” in the comments if this is your kind of entry.
📈 Tag a trader who needs to stop fading Smart Money moves!
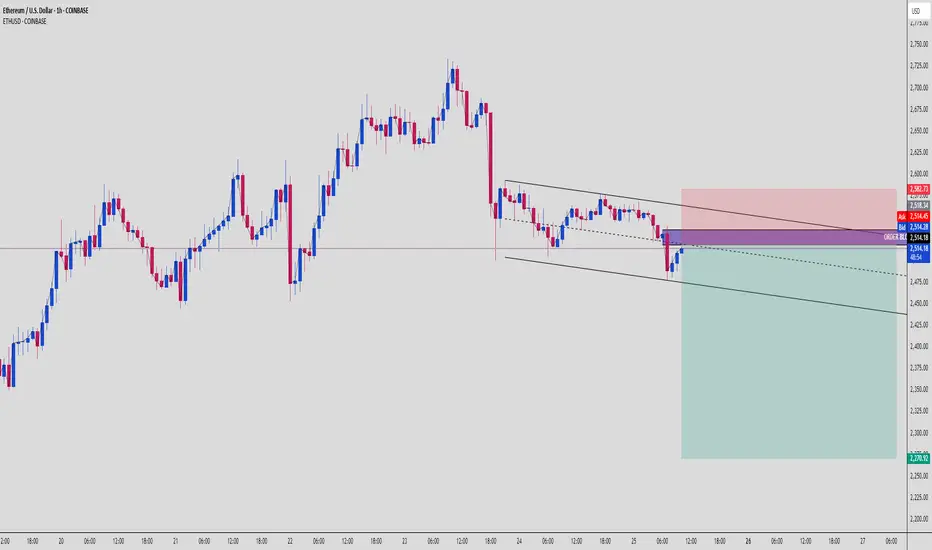
ETH Just Slapped Into an Order Block — Next Stop: Dump City?🔎 Ethereum Smart Money Sell Setup | May 17, 2025
The ETH/USD 30-minute chart just gave us a juicy bearish confirmation off a clean Order Block rejection, wrapped in a downward sloping parallel channel — exactly what smart money watches for. Here’s the breakdown:
🧩 1. SMC Narrative
Price tagged a bearish OB right at the mid-supply zone 🟣
Followed by strong engulfing rejection candle
Breakdown from the minor trendline support → confirms bearish shift
Order block lines up with the premium zone of the overall bearish channel
Retail might think this is support — we see liquidity 👀
🎯 2. Trade Specs
Entry: ~2,516.09 (OB upper edge)
SL: 2,520.00
TP Zones:
TP1: 2,476.99 ✅ (almost hit)
TP2: 2,450
TP3: 2,409.47 (final target at channel low)
Risk-to-Reward: Approx 1:4.5
🛠️ 3. Why This Setup Works
Price delivered a channel breakout + OB rejection combo
Strong volume spike during the OB touch = institutional activity
The bounce off the OB is weak — signaling exhaustion
All signs point to a grind down to lower channel support
If you know, you know — this is how banks exit in stealth mode 🚪👻
🎯 Bonus Tip:
If ETH retests the OB zone again with weak bullish candles — that’s your secondary sniper entry 🎯
📣 What’s your bias? Think bulls can reclaim this OB, or are we headed straight into deeper discount pricing?
📲 Follow @ChartNinjas88 for daily laser-focused setups, SMC concepts, and precision trading breakdowns!

EUR/JPY Technical Breakdown: Rising Wedge Breakdown + Target🔺 1. Rising Wedge Pattern Explained
A Rising Wedge is formed when:
Price action creates higher highs and higher lows, but
The slope of the support line is steeper than the resistance line.
This signals that buyers are losing strength, and momentum is fading.
In this chart:
The wedge began forming around mid-February 2025.
Price was compressing within converging trendlines.
After multiple failed breakouts near resistance (~165.50), the pair finally broke below the lower trendline, confirming a bearish breakout.
This pattern is considered reliable because it traps late buyers and shifts sentiment from bullish to bearish quickly once the lower boundary is breached.
🔻 2. Key Technical Zones
📌 Major Resistance Zone (~165.00 – 166.00)
Strong supply area; price has rejected here multiple times since late 2023.
Resistance was confirmed again during the wedge formation.
High volume spike noted near this level, followed by a steep drop—evidence of distribution and smart money exiting long positions.
📌 Major Support Zone (~156.00 – 157.00)
Historically held as a demand zone.
Previous bounces suggest it is structurally significant.
However, repeated tests can weaken the zone, increasing the likelihood of a breakdown.
🎯 Target Price: 153.433
Measured by taking the height of the wedge and projecting it from the breakout point.
Coincides with a previously tested level (support turned target).
Bears could aim for this level as a swing target.
📉 3. Market Psychology Behind the Pattern
As price climbs inside a rising wedge, volume often declines, showing buyer exhaustion.
False breakouts near the top of the wedge trap breakout traders, adding fuel to the downside move once price breaks the lower boundary.
The sharp selloff post-breakout is often driven by stop-loss cascades and aggressive short positioning.
🔁 4. Potential Price Path & Trade Plan
Retest in Progress: Price may retest the broken wedge support (now resistance) near 163.00–164.00 before further decline. This retest zone offers a high-probability short entry opportunity with tight risk management.
Immediate Downside Levels: 160.00 (psychological level), 157.00 (support zone), and final target at 153.43.
Bearish Continuation Scenario: If the pair maintains below the wedge and forms lower highs, it confirms ongoing bearish sentiment.
🛑 5. Risk Factors to Monitor
ECB or BOJ monetary policy shifts (rate cuts/hikes, yield curve control updates).
Risk-on vs risk-off flows, especially in times of geopolitical or macroeconomic shocks.
Intervention by the Bank of Japan to protect JPY from excessive weakening.
✅ Conclusion: A Tactical Short Opportunity
The EUR/JPY chart is setting up for a potential medium-term short swing trade following a confirmed rising wedge breakdown. With clear rejection from a long-standing resistance zone and fading bullish momentum, the technicals align for a move toward 153.43 over the coming weeks.
Traders should watch for clean retests and structure-based entries, managing risk around 164.50 with profit-taking at key support zones along the path.

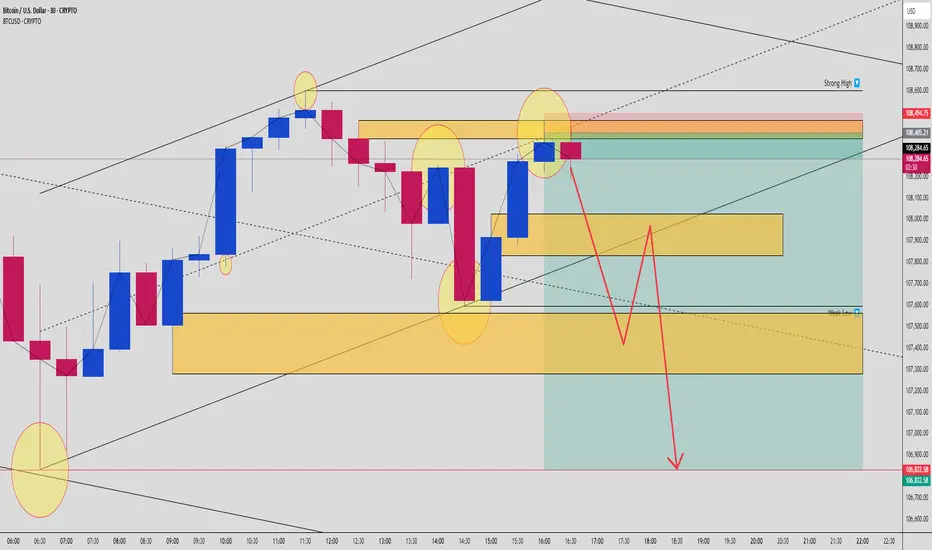
BTCUSD Smart Money Reversal: OB + FVG Trap Targets Weak Lows🚨 BTCUSD Smart Money Concept Alert (30-Min Timeframe)
A classic bearish setup is unfolding on Bitcoin, and it’s screaming trap + reversal for anyone watching closely. Here’s why this could be your high-probability short of the week… 👇
🔍 1. Liquidity Sweep at Key High
We just saw a clean sweep of prior swing highs near 108,400 – a clear signal that Smart Money has hunted liquidity above weak retail stops. That big push into the premium zone? Not real demand. It’s engineered manipulation. 🔧
📉 2. Premium OB + FVG Confluence
Price has just tapped into a juicy confluence zone:
🔲 Order Block @ ~108,400–108,494
🟦 Fair Value Gap (FVG) imbalance sits right below
🎯 All aligning with 61.8–79% Fib retracement from the prior bearish leg
This is where Smart Money institutions enter the party. Look left: it’s the same game played again and again. Trap the highs, fill the imbalance, then dump.
🔄 3. Reversal Evidence Already In Play
A bearish reaction candle confirms rejection from this OB zone. The wick shows aggression – a clear sign of selling pressure stepping in at the premium.
Expectations now shift from retracement to trend continuation toward unmitigated demand zones below.
🧠 4. Weak Low & Liquidity Engineering
Below current price lies a weak low around 107,300 – that’s your magnet. Price needs to sweep that inefficiency, and the structure suggests liquidity vacuum mode is active.
Key zone targets:
🟨 First TP: 107,800 (FVG base)
🟨 Second TP: 107,300 (weak low sweep)
🔻 Final TP: 106,832 (full mitigation zone = 1400+ pip potential)
🎯 5. Execution Plan
💼 Smart Entry:
Entry zone is anywhere from 108,250 to 108,490 (OB + FVG overlap)
SL above 108,600 (structure invalidation)
📊 Targets:
TP1 – 107,800
TP2 – 107,300
TP3 – 106,832
⚖️ RR: ~1:3 or better if executed precisely
🧩 Market Psychology:
This isn’t just technicals. It’s narrative vs. reality.
Retail sees breakout → Long
Smart Money sees sweep → Sell
Retail buys late → Fuel for Smart Money exits
🛡️ Risk Reminder:
Trade the setup, not emotions. Let price come to your zones. Stay mechanical, not emotional. Partial out and trail stops once TP1 hits. Never chase.
✅ Summary:
BTCUSD is showing a perfect bearish Smart Money setup. OB + FVG confluence, strong premium reaction, engineered weak low, and liquidity zones below. Textbook SMC pattern. Play it right, and this setup could deliver clean, high-RR profits.
⚡ Drop a “BTC READY” in the comments if you're watching this one with sniper focus.
🧠 Tag a trading buddy who still thinks we’re in a breakout!
Gold Bulls showing Fatigue at 78.6 Fib. Reversal Incoming?Price just tapped into a key confluence zone around 3367–3376, aligning with the 78.6% fib retracement, previous resistance, and a psychological level.
The latest 4H candle is showing classic buy exhaustion — long upper wick, small body, and failure to close above resistance. This could be the first sign of a momentum shift or short-term pullback.
I’m watching for a bearish confirmation candle next. If that shows up, a sell setup targeting back to 3325/3310 could develop.
Aggressive sellers might already be in. Conservative ones may wait for a clean bearish engulfing or break of market structure.
