AUD/CAD: Short position by fundamental newsAs today, I short AUD/CAD from $0.9076 CAD, Stop Loss to $0.9104 CAD and take profit to $0.9023 CAD. All update for now!!!
What I see it's that AUD/CAD break out this bearish channel formed in H4 timeframe and we see a good opportunity that I'm shorting now
Now, watching in H4, I believe that price will need to make a reaction in the up trend line that I extend now and show you by blue arrow a point that posible to entry to bought inmediately after this drop that it's happening now by China economy. We could to see a support at $0.9026 CAD as main support to take in note.
In based the fundamental news, it's that Chinese industrial, retail sales fixed asset investment fell in the estimate today data in China economy with concerned about the disappointing global recession fears. i see that this will affect the Asian currencies to short position by this bad speculate in the world. I'm shorting Australian Dollar in front of Canadian Dollar now!!!
If you short AUD/CAD from by signal in the noon, we're in profit for now to find up 55 pips as target.
Good luck!!!
I put my link to related idea my first simple analysis, this it's the udpate!!!
Bearishsetup

GBP/CAD: ReviewGreat Britain Pound/Canadian Dollar was one of the best trade that I have, together with GBP/AUD and AUD/CAD. But this trade was hard because I believe that GBP will strength, but the price continue drop into this consolidation that I identify it.
We formed a bearish descending triangle and right now, made this break out what I get 6.50% earns or equivalent of 101 pips
So guys, as I had 16.69% and sum 6.52% in this trade, so I get in total 23.21% of earned.
So, this it;s the end of this week that I finished with 23.21% earnings and -3.87% lossing. So, compared with the last week, in total to reach my 20% monthly, my % in progress it's around 11.67% in this month in August, but my goal it's to reach 20% monthly, as minimum goal.
I'm very well for now!!!
So guys, every week, I will do review on Forex par to know what I did good? as What I did bad? Because, this it's my evaluation to know my performance in my trading and my experience.

AUD/CAD: Weak in the price actionAustralian Dollar/Canadian Dollar look that the price doesn't continue climb, but we analyze it that in all timeframe in H1 and H2 look bearish, what we ned to change our mindset to short AUD in front of CAD. I will make this quickly analysis to short AUD as the price make resistance in this grey zone that I draw in H1 timeframe.
I entry now in the market price, Stop Loss to $0.8998 CAD and take profit to $0.8914 CAD.
I hope that this idea support you1!!
I closed up my long position now!!!

PFE: Triangle break!Pfizer
Short Term - We look to Sell at 50.48 (stop at 52.47)
Our outlook is bearish. Broken out of the triangle formation to the downside. This is negative for sentiment and the downtrend has potential to return. Further downside is expected although we prefer to sell into rallies close to the 51.00 level.
Our profit targets will be 45.49 and 42.00
Resistance: 50.00 / 54.00 / 62.00
Support: 45.00 / 40.00 / 34.00
Please be advised that the information presented on TradingView is provided to Vantage (‘Vantage Global Limited’, ‘we’) by a third-party provider (‘Signal Centre’). Please be reminded that you are solely responsible for the trading decisions on your account. There is a very high degree of risk involved in trading. Any information and/or content is intended entirely for research, educational and informational purposes only and does not constitute investment or consultation advice or investment strategy. The information is not tailored to the investment needs of any specific person and therefore does not involve a consideration of any of the investment objectives, financial situation or needs of any viewer that may receive it. Kindly also note that past performance is not a reliable indicator of future results. Actual results may differ materially from those anticipated in forward-looking or past performance statements. We assume no liability as to the accuracy or completeness of any of the information and/or content provided herein and the Company cannot be held responsible for any omission, mistake nor for any loss or damage including without limitation to any loss of profit which may arise from reliance on any information supplied by Signal Centre.

EUR/GBP: Bearish Elliot Wave CycleEuro/Great Britain Pound forming a nice opportunity that you can to short EUR/GBP in this week and find down sell in the trend.
This it's the Daily analysis, I hope that this idea support you!!!

Cardano look bearish in weeklyCardano look bearish in weekly chart as we see that we're in the bullish correction before to continue drop. But we hope to find down a good opportunity to short ADA, I believe that it's not far to reach down $0.17 cents, but this it's some possibility to happen. But Cardano could to reach down to $0.27 cents in the next weeks to see.
Also guys, buying Cardano below of $0.30 cents it's very good to accumulate ADA in this bear market and preparing your cash to buy this cryptocurrency and hold for ever until reach your own goal. Also, I draw the Cardano logo here and look precious and beautiful my design to present this cryptocurrency for crypto-enthusiastic.
I hope that this analysis support you!!!

Weekly Analysis Overview: BitcoinIn this weekly analysis, Bitcoin it's in the 0.382% Fibonacci level, what we could to expect a market crash of another 40% to see. I expect that Bitcoin goes to $17,600 USD, and also the most lower price will be around $13,450 USD to watch and look if that price could be the stop of the bear market to know what could to happen in the future.
I'm still bearish in Bitcoin and altcoins.

EUR/AUD: short positionEuro/Australian Dollar look bearish and good opportunity to watch because it's forming s good entry to short.
AUD look more strength than Euro and Dollar. I will shorting Euro now!!!
Stop Loss to $1.4644 AUD. The take profit to $1.4525 AUD snd I entry in the market price to short

AUD/USD: short positionAustralian Dollar/U.S. Dollar look bearish by the Australia Central Bank what make a hike interest rate 1.85%, what Australian economist predicted.
Right now, Aussie look weak in front of U.S. Dollar, what we could to see a good opportunity to short AUD/USD
The H4 timeframe look bearish in this side.
I will put a sell order limit to $0.6940 USD, Stop Loss to $0.6977 USD (-37 pips) and take profit to $0.6868 USD (72 pips). We have this opportunity after this important event what Australia Central Bank made today.
I hope that this analysis support you

EUR/USD: Supply & Demand zoneEuro/U.S. Dollar forming a supply & demand zone that you can to view in H4 timeframe. But we could to entry to short once that the price forming another sell opportunity that you might to wait
This it's the H4 timeframe, and we have the chance to short EUR/USD
i hope that this idea support you!!!

BTC/USD: bearish engulfing patternBitcoin forming a bearish engulfing pattern in H4 timeframe in the good zone to short into this chartist pattern (bearish channel perspective)
Trade Info:
1) Entry: $24,050 USD (sell order limit)
2) Stop Loss: $25, 230 USD
3) Take Profit: $21,000 USD
4) Risk/Benefit: 1:2
I hope that this analysis support you to short Bitcoin

Bitcoin forming a bearish channel perspective!!!Analyzing the Daily timeframe, we could to expect another possible crash in the Bitcoin price. But it's very important to analyze well the fundamental analysis in this week incoming what we expect from more news in macroeconomic point.
Also, I draw a model of this bearish channel perspective and I believe that we formed the ABCDE pattern correction into this chartist pattern. Remember that we're in the bear market, and it's not sure that Bitcoin going to up, at least combining our technical analysis with fundamental news that affect Bitcoin price. Right now, we see a bearish hammer candlestick formed in Daily timeframe indicating sell-off. There's a possible short position to $21,300 USD to take advantage of this trade if you trade cryptocurrency
I hope that this idea support you!!!

BTC/USD: Bearish channel outlookBitcoin forming a bearish channel that still in this downtrend and we're in the good point to short in Daily timeframe to short this bear market. Also I read that Elon Musk (CEO of Tesla) sold all his Bitcoin worth in over $770 million. Also for reference, I apply the fibonacci level and Bitcoin it's in the point of 0.382% to sell in this timeframe. We formed a bearish hammer indicating sell-off.
I will take a short position now and I put my sell order limit to $22,500 USD. Stop Loss to $25,650 USD and my target to $14,000 USD.
I see a bearish perspective in Daily and Bitcoin it's preparing to another crash incoming.
Good luck!!!

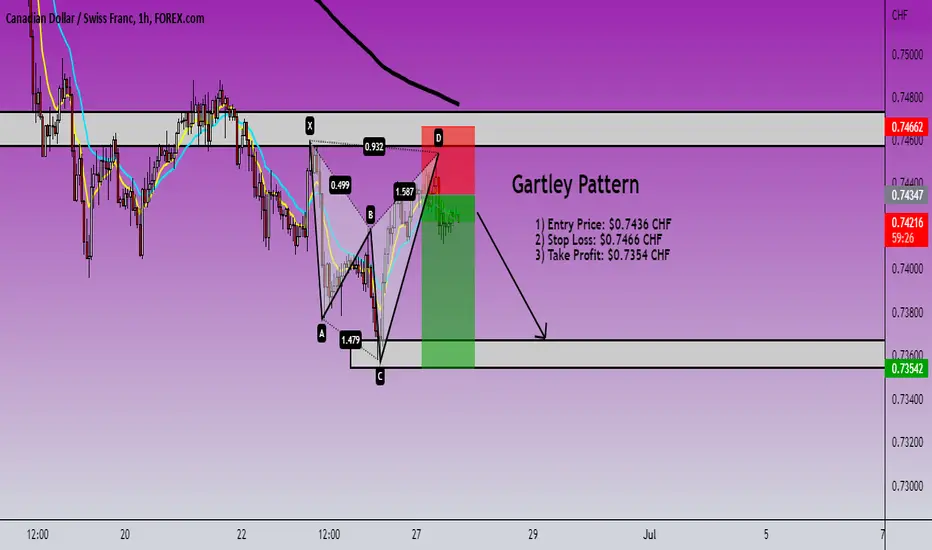
CAD/CHFAt the moment, Canadian Dollar/Swiss Franc forming a nice bullish rising wedge and could to make an interesting movement that we could to find up long position in the smart zone to bought.
As I'm shorting CAD/CHF and I'm in profit with over 30 pips. This analysis look very interesting to have a trade plan.
i hope that this idea support you!!!
In Daily timeframe, we could to see an interesting chart to look because the candlestick still in this downtrend, and we could to see that price could to move to $0.7380 CHF (Daily strong support) that I show you here.
I'm shorting CAD/CHF what I made a comment in my past analysis CAD/CHF to short on Tuesday, what I expect to down, then up as I expect and now the price was in the weak, but now, I'm in profit in CAD/CHF.

USD/JPY: bearish channel flagU.S. Dollar/Yen Japanese forming a bearish channel flag, what we could to look a short opportunity in USD/JPY in H2 timeframe. Analyzing the price action, the trend it's move the Dollar to the downside. Also on Wednesday, we hope a fundamental news that Federal Reserve reduce the hike interest rate to 0.75% and cooling down the inflation. Also, this will be transitory this bearish side, because that put in good point that Dollar still in the strong in front of currencies and assets, what make a bull cycle in the Dollar.
So, but now, I see a short position. I add a sell order limit to $136.55 JPY. Stop Loss to $137.01 JPY and target to $134.90 JPY.
This it's the H4 timeframe because we broke-down the up trend line and right now, there's an indication to sell USD/JPY
I hope that this idea support you!!!

GBP/CAD: UpdateGreat Britain Pound/Canadian Dollar stil in this downtrend. Also I will do this update in this Forex par as this it's a short opportunity that I see in H2 timeframe. Also, my sell order limit around $1.5456 CAD was activated and I'm shorting this par with +20 pips earned for now. Also, the par it's in this opportunity that you can to put a sell order limit to $1.5450 CAD approx. and the same Stop Loss that I have in the box where to say trade information, you can to view my details.
GBP/CAD break out this bullish diagonal line and we see a good momentum to short GBP/CAD
The price it's into this bearish channel formed in H4 timeframe
Good luck if you short GBP/CAD

EUR/AUD: 0.618% Fibonacci gold entryEuro/Australian Dollar look bearish in this side following the bad news in Euro currency and economy and how this Eurozone economy will affect the gas crisis through the world. So, I want to share some screenshot that I share here.
Euro it's look extremely bearish in Daiy timeframe and also, I hope an opportunity that we could to short EUR/AUD during days and weeks to see.
EUR/AUD it's in the gold zone in the 0.618% fibonacci key level and I see a good trade that we could to find down 194 pips in this only trade.
So, I will put a sell order limit to $1.4930 AUD. Stop Loss to $1.5005 AUD (75 pips) and take profit to $1.4735 AUD (194 pips)
So, I hope that this analysis support for you
Good luck!!!

GBP/USD: bearish perspective; udpateSterling Pound/U.S. Dollar it's in the supply zone, but I decide to closed up manually this trade right now. But if we see another opportunity, only we would need to wait the reaction in that grey zone and also in the blue line of the supply zone to watch.
So, I will wait a little more, as I believe that Sterlign Pound get manipulaton in that zone. For that, hope next opportunityt to short in the supply zone.
Meanwhile, we're in the bearish channel and Sterling Pound it's moving to the downside what we can to short GBP/USD
I hope that this analysis support you!!!
I'm in short in GBP/CHF and EUR/AUD.

GBP/CHF: UpdateAt the moment of this analysis, Sterling Pound stil failling in front of Swiss Franc. Alos, I mentioned yesterday that I pushed a sell order limit to $1.1680 CHF, now in the morning Sterling Pound climb a little and my Stop Loss still around $1.1719 CHF. And also the movement that made Sterling Pound was manipulated and my position in Sterling Pound/U.S. Dollar I have been liquidated loss 3.02 % in this trade. What Sterling Pound it's in bearish movement in front of U.S. Dollar and Swiss Franc.
It's mean:
GBP/USD = bearish
GBP/CHF = bearish
So, GBP/CHF continue in my right direction and at the moment I'm in profit with over 40 pips what I see. My own target still around $1.1530 CHF around 151 pips
This it's my udpate of my par GBP/CHF!!!
This it's the H4 timeframe

NZDUSD - DAILY CHARTIts looking bullish, waiting for the NZDUSD - DAILY CHART - to correct and then give us short opportunities.
Note: its my view only and its for educational purpose only. only who has got knowledge in this strategy will understand what to be done on this setup. based on my technical analysis only.
buy low and sell high concept. buy at cheaper price and sell at expensive price.

GBP.CHF: short positionSterling Pound/Swiss Franc it's look bearish too like GBP/USD
In H4 timeframe, we formed a bearish butterfly harmonic pattern. And also, analyzing the fibonacci, we're below in the 0.782% to see a possible short position in this trade.
I put a sell order limit to $1.1681 CHF, Stop Losss to $1.1719 CHF (38 pips) and huge take profit to $1.1529 CHF (152 pips)
Good luck

CAD/CHF: UpdateThis it's just my update of my previously analysis CAD/CHF what we're in the good point to short.
The info it's in the display. We forming a Gartley Patternand reach the 1.272% Fibonacci key level to short.
The H4 timeframe still bearish in this par
Good luck!!
Cardano forming a symetric triangle to overview now!!!Cardano price forming a symmetric triangle in 3 Daily timeframe and it's in this clearly consolidation that could to up to $0.61 cents again to watch this smart price to sell this cryptocurrency, and also entry in the smart point to sell and following the trend always.
So, I will closed up my short now because crypto could to up a little ,but it's not to the moon and always following the trend it's a key to learn very good.
In Daily timeframe, we formed a demand zone over here around $0.47 cents and price continue climb to see now a possible chartist pattern in formation.
So guys, I have this perspective shorting ADA in 3 Daily timeframe. I expect that the price climb to $0.61 cents approx. and then wait to entry in short position in that zone to sell Cardan toward my new point $0.20 cents. This it's a crash of almost 70%
I hope that this idea support you
