EURUSD Bearish Market Structure Unfolding – Liquidity Grab BelowEURUSD Bearish Market Structure Unfolding – Liquidity Grab Below Support Expected"
🔍 Technical Analysis Breakdown:
🔺 Resistance Zone (1.17500 - 1.18500)
Labelled “Strong High”, this is a high-supply zone where price previously reversed.
Multiple Break of Structure (BOS) and Change of Character (CHoCH) confirm this as a strong bearish supply area.
Any retracement toward this level could be ideal for short entries.
🟩 Fair Value Gap (FVG)
This imbalance area previously served as a magnet for price before it broke down.
Price failed to hold inside the FVG, reinforcing bearish sentiment.
🔻 Support Zone (1.13500 - 1.14000)
Marked as a "Weak Low", suggesting this level is likely to be taken out in a liquidity sweep.
Price is expected to retest and potentially break below this zone in the near term.
📉 Current Price Action
Recent CHoCH (Bearish) confirms shift in structure.
Price has made a corrective pullback and seems poised for another leg down.
Highlighted grey zone suggests price may retrace slightly higher before continuing its bearish move.
🎯 Bias: Bearish
Expecting downside continuation toward 1.13500 support, targeting liquidity below.
Traders may wait for rejection signals on lower timeframes around the minor pullback zone before executing shorts.
📚 Educational Notes:
CHoCH indicates a shift in market sentiment (from bullish to bearish).
FVG often acts as a magnet but if not respected, confirms momentum in the opposite direction.
Support/Resistance zones are used to determine institutional activity zones.
Bearishtrend

EURAUD - Bearish H*S Retesting Double Tops LevelEURAUD is approaching a strong reversal area which we could see a retest before the next leg down. Wait for bearish confirmation on LTF before entry.
Good Luck

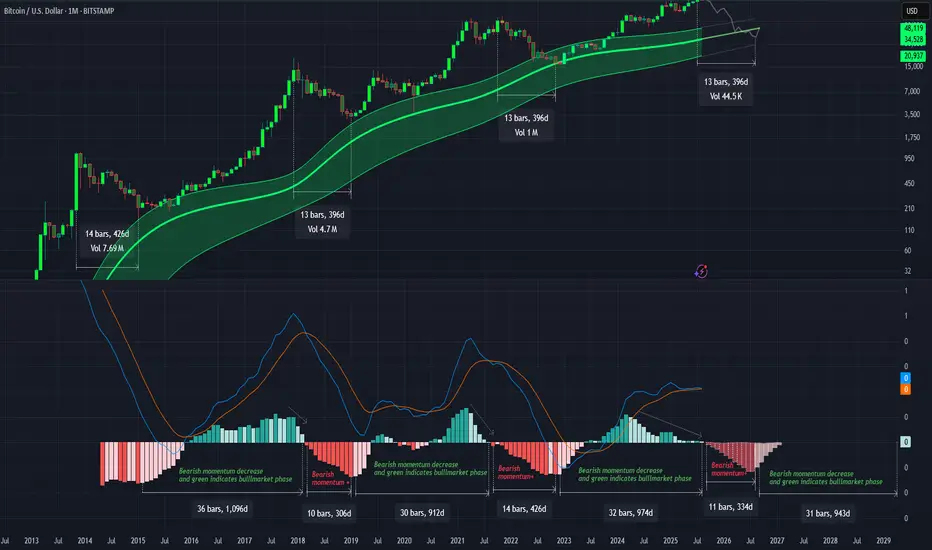
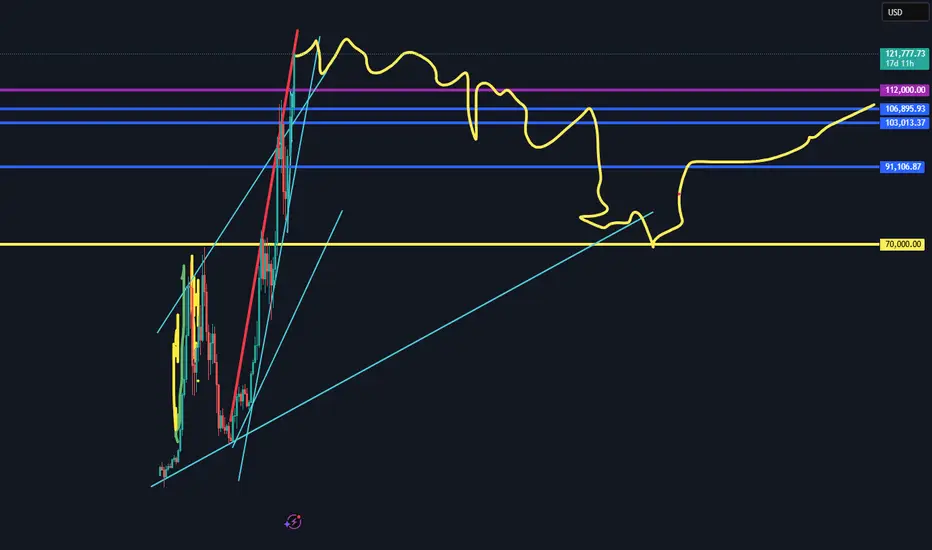
"When the sea retreats and whispers low through Gaussian"This time we are going to talk about the neck of the Bull Markets tops. "IF" I nailed it predicting the top ~ 123k we might start talking about the neck of the hill around the 0.236 Fib level. This could be the next target for Bitcoin in the coming months around 76K(yellow zone). Once the 1000 days of green above Gaussian ends we might see the biggest drops of the bear market bottoming around the 0.5 fib level in the lows 40k usd.

BTC Hits Premium Zone – Bearish Reversal Loading? BTC Hits Premium Zone – Bearish Reversal Loading?
🧠 Technical Breakdown:
🔹 1. Previous Market Structure & CHoCH
The chart shows a clear shift in structure (CHoCH) on the left, which marked the start of the bearish leg.
Break of Structure (BOS) confirms continuation of lower highs and lower lows until recent liquidity grab near the $112,551 zone.
Equal highs and liquidity above were taken out, making the move into the Premium Order Block zone highly significant.
🔹 2. Liquidity and Fair Value Gap (FVG) Zones
A major Liquidity + FVG zone was left unmitigated between $113,000–$112,000, and price is likely to revisit it.
This aligns with the target zone at $112,890, which is highlighted as a magnet for price to rebalance the inefficiency.
🔹 3. Order Block & Premium Supply Zone
A well-defined Order Block is marked just below the resistance zone near $115,166–$116,021.
Price is currently retracing into this zone, suggesting a potential reaction point for smart money to re-enter shorts.
Volume is expected to pick up here, and a reversal could initiate if price fails to break above this supply.
🔹 4. Volume Profile and Market Imbalance
Volume clusters are heaviest near the $114,000–$114,300 range, indicating high activity and previous accumulation/distribution.
Thin volume near the $112,551 zone further confirms price may drop quickly if rejection happens.
🔹 5. Support & Liquidity Sweep
Support zone around $112,551 is a previous liquidity pool and weak low that has not been fully cleared.
Price is likely to revisit this zone in the short term to clear liquidity and complete market rebalancing.
🔐 Institutional Narrative:
Smart money engineered a liquidity sweep to the downside, then caused a retracement into premium.
Now, BTC/USD is positioned in a high-risk zone where sell-side institutions may enter to push price lower.
If this order block holds, expect a rejection toward $112,890, followed by possible deeper continuation into the liquidity void below.
📌 Key Levels:
Level Price (USD)
Strong Resistance Zone 115,166 – 116,021
Order Block (Sell Area) 114,800 – 116,000 (approx.)
Immediate Support 113,000 – 112,551
Target (Liquidity Zone) 112,890
Weak Low (Final Sweep) 112,000
📉 Trade Outlook & Strategy:
🔺 If price reacts bearishly at Order Block:
Look for lower timeframe BOS/CHoCH confirmation.
Entry: Short on rejection at or near $115,000–$115,500
Target 1: $112,890
Target 2: $112,000 (extended liquidity sweep)
Stop-loss: Above $116,200 (invalidates bearish OB)
🔻 If price breaks and closes above $116,021 with momentum:
Structure flips bullish, and the OB is invalidated.
Look for long setups on retracement to $114,000 zone.
🧭 Conclusion:
BTC/USD is currently trading within a Premium Zone, testing a strong Order Block below key resistance. Price may face a bearish reaction, targeting the liquidity zone at $112,890. Smart money footprints suggest a potential trap for breakout buyers, and if momentum fades, we can expect a downside reversal to sweep remaining liquidity.

Gaussian and the LMACD deep dive!As you can see LMACD is showing signs of exhaustion. Histogram has been compressing or decreasing in momentum while the price has been climbing up. This divergence wont last for too long and a change in the trend seem very likely. BTC might be entering in the bear market pretty soon and you might start seeing the histogram turning red and increasing in bearish momentum before changing the trend once we approach to the core of the Gaussian or even bellow this time. Breaking bellow the core would mean range bellow 40k as bear market bottom.
GBPUSD is in Bearish Reversal Head & ShoulderGBPUSD is showing clear bearish head & shoulder pattern on daily chart it will retrace for some time to get close to the price 1.33788 at that point short sell will be good

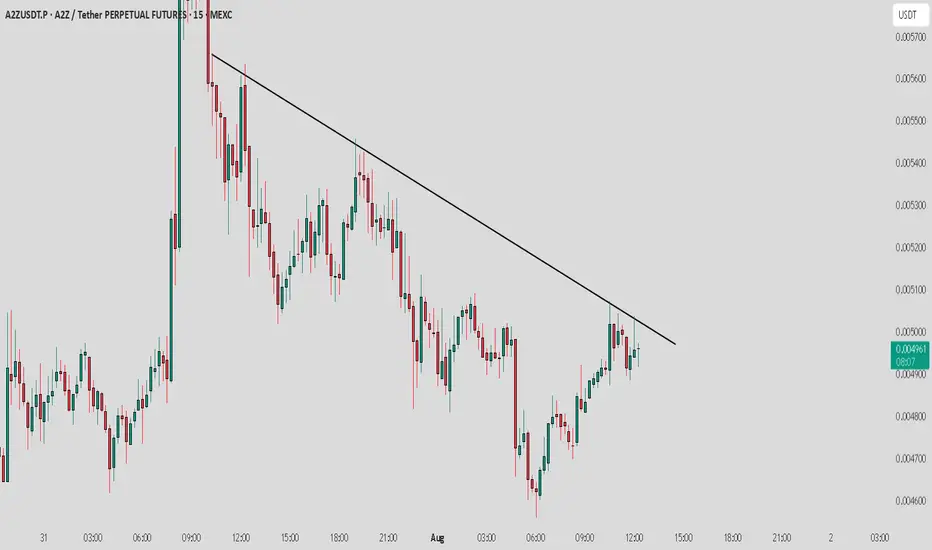
A2Z / USDT : Near trendline and showing weakness, Avoid long A2Z/USDT - Nearing Trendline Resistance
A2Z/USDT is approaching a crucial trendline resistance.
Bearish Scenario:
Failure to break the resistance could lead to further consolidation or a potential reversal, testing lower support levels.
Keep an eye on the trendline and volume for the next key move.
Bearish Retest Setup After BreakdownPrice broke down from the recent bounce and lost the 0.098–0.101 zone, which lined up with the 23.6–38.2 fibs. That area is now likely to act as resistance. Momentum is still bearish. MACD histogram is red and expanding, and no signs of reversal yet. On the daily timeframe, MACD has just started to cross bearish, which adds weight to the downside bias.
If price retests that 0.098–0.101 area and shows weakness (like rejection wicks or small-bodied candles), it’s a clean short opportunity. First target would be the recent low around 0.092, and if that breaks, the next key level is 0.077.
Any push above 0.102 would invalidate the setup for me.

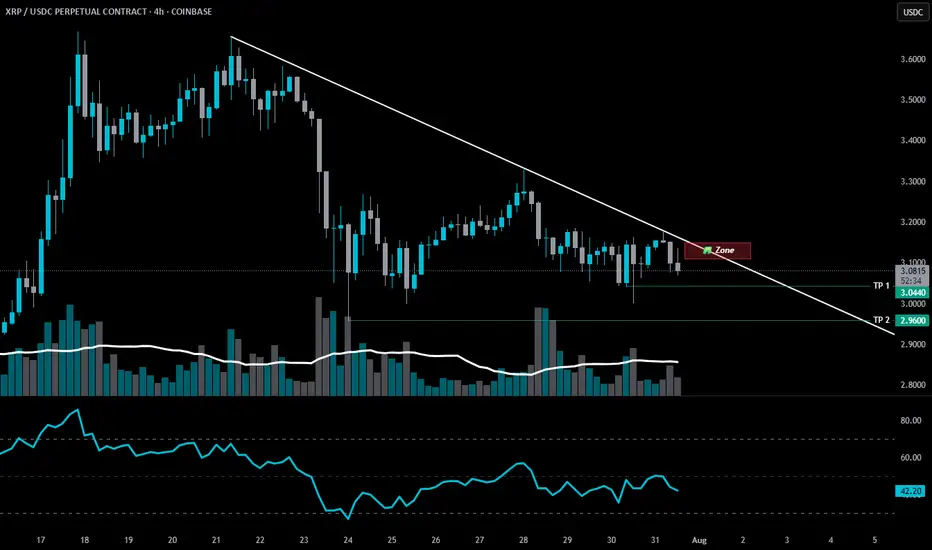
SHORT ZONE-XRP structure shiftThere was an XRP structure shift last week.
📉 It’s been bleeding ever since.
Now, another bearish setup is forming.
If XRP nears that descending trendline and fails to break through — it enters the SHORT ZONE.
🚫 No breakout? No mercy.
This isn’t the end for CRYPTOCAP:XRP — but a purge may be necessary before liftoff.
A proper cleansing to prepare for the next ascension.
🫡 xrpArmy, forgive me…
But hey, feel free to earn your keep.
Stay Sharp. Regulate Yourself.
🚫 100% NOT financial advice.
🎭 Edutainment purpiz only.
GBPUSD BEARISH POTENTIAL The daily time frame for GBPUSD is showing me that price has formed a head & shoulders pattern, breaking through the former support now resistance level. Price is currently sinking to my 1.31000 mid level, once the level is reached it will either breakthrough or bounce off of it to retrace and continue to build bearish structure.

GBP/USD 4H Chart Analysis (Bearish Flag) Read the caption📉 GBP/USD 4H Chart Analysis
Pattern Identified: Bearish Flag Pattern
Timeframe: 4-Hour (4H)
Currency Pair: GBP/USD
🔍 Chart Explanation:
This chart illustrates a classic Bearish Flag Pattern, which is a continuation pattern signaling a potential further decline in price after a temporary consolidation.
Downtrend Leg (Flagpole):
The strong and sharp bearish move on the left side of the chart forms the flagpole, indicating aggressive selling pressure.
Consolidation (Flag Formation):
Price enters a rising channel (the flag) which reflects a short-term corrective phase or pullback. This consolidation occurs within the Resistance Zone, suggesting weakening bullish momentum.
Resistance Zone:
Marked in blue, this zone is where the price struggled to break above, and it acts as a ceiling. Rejection from this zone confirms bearish pressure and increases the likelihood of a breakdown.
Breakdown & Target Levels:
The chart shows that price has broken out downward from the flag pattern, triggering a continuation of the prior downtrend.
Two important support levels are highlighted:
🔸 1st Support: 1.33449 – This is the immediate target where price may pause or react.
🔸 2nd Support: 1.32408 – This is the extended target if selling pressure continues.
Ichimoku Cloud (Background):
The cloud behind the price action represents market sentiment. The red cloud suggests a bearish bias aligning with the flag pattern breakdown.
🧠 Technical Summary:
This setup favors a sell-side outlook. The rejection from resistance within a bearish flag and subsequent breakdown confirm bearish momentum. Traders may look for selling opportunities below the flag breakdown with targets at the mentioned support zones.

#PENGUUSDT confirms a bearish impulse📉 SHORT BYBIT:PENGUUSDT.P from $0.034625
⚡ Stop loss $0.035646
🕒 Timeframe: 4H
⚡ Overview:
➡️ A Double Top pattern BYBIT:PENGUUSDT.P has formed, signaling a bearish reversal.
➡️ The price broke the $0.0355 support and is consolidating below, confirming seller strength.
➡️ Increasing sell volume confirms bearish control.
➡️ Main focus on targets in the $0.034–0.033 zone.
➡️ The POC at $0.03113 remains the ultimate bearish objective.
🎯 TP Targets:
💎 TP 1: $0.033947
💎 TP 2: $0.033369
💎 TP 3: $0.032948
BYBIT:PENGUUSDT.P Trade Recommendations:
📢 Hold short towards the TP zones.
📢 Watch for reaction around $0.0339 — partial profit-taking possible.
📢 Invalidation if price reclaims above $0.0356.
⚠️ As long as bearish pressure holds, the price is likely to continue towards TP2–TP3.
⚠️ A recovery above $0.0356 would invalidate this setup.
🚀 The signal confirms a bearish impulse — expecting further downside!

EUR/USD Elliott Wave: Corrective Pullback in Progress Wave ((4))EUR/USD 4H chart with Elliott Wave count. The pair remains in a steady downtrend after peaking at the wave (C) high, and is now in the middle of a larger wave iii decline. Bearish impulse waves dominate, with lower lows confirming the trend (mid-wave iii scenario). Now expecting a wave ((4)) relief bounce (corrective) within this wave iii. Price could rebound toward 1.15788–1.16153, the ~38.2–50% Fibonacci retracement zone of the prior drop.
This area is a likely resistance for the bounce, suggesting only a temporary uptick in an otherwise bearish move. After wave ((4)) completes, the downtrend should resume as wave ((5)) of iii kicks in. The next downside target is around 1.13974 (or lower) – near a 1.618 Fibonacci extension projection where wave ((5)) may complete. This would likely finish wave iii and aligns with the broader bearish Elliott Wave count.

XAUUSD DEVELOPS MID-TERM BEARISH IMPULSEXAUUSD DEVELOPS MID-TERM BEARISH IMPULSE
Yesterday was the 4th bearish day in a row for gold. The reasons are the same as for the EURUSD: American-European trade agreement. Geopolitical risks got eliminated and market participants get rid of the bullion. "If more ‘trade deals’ are reached, this could help to reduce this source of policy uncertainty that has weighed against the dollar, at least for now. It could also see other factors such as relative yields becoming more influential," said Paul Mackel, global head of FX research at HSBC.
Technically, the price has broke down the former trendline and is currently staying slightly above the local support of 3,300.00. It is expected for rebound to continue, retest of the trendline is possible with further decline towards 3,200.00 support level.

Waiting for Gold to Dump| Area Of OpportunityWe can clearly see the overall trend of Gold, which is bearish. As the price action we see bearish FVA (Fair Value Areas/Swing Lows) being run. The anticipation is to wait for the latest Swing low to be ran, before looking for entries.
Why?
Because, the path towards our nearest POI (Point Of Interest) will have a low resistance. Meaning price might expand lower smoothly.

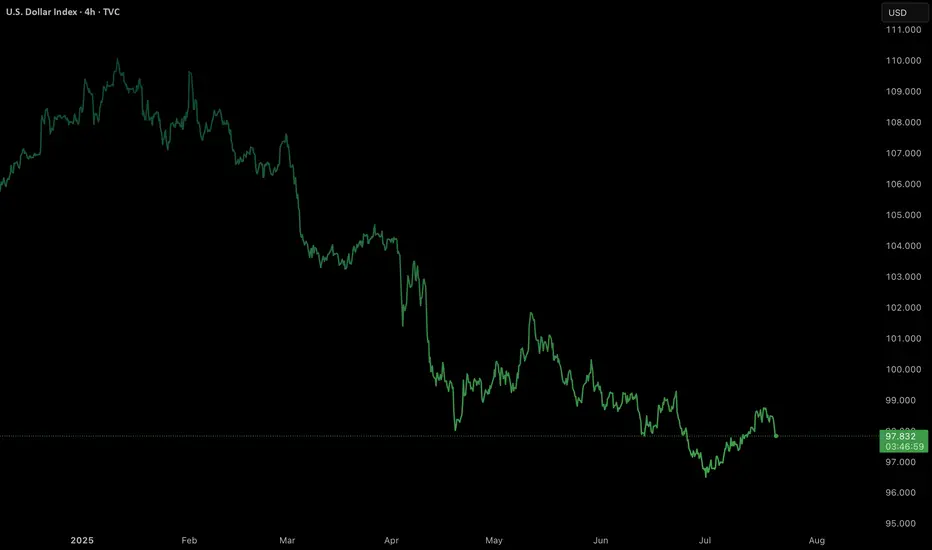
U.S. Dollar (DXY) bearish?Will dollar continue its bearish momentum or will it reverse?
Technical Summary
DXY remains in a firm bearish trend, having dropped around 11% this year. The setup is formed by a chain of lower highs and lower lows, confirming an unrelenting downtrend.
Support Level: ~97.70
Resistance Zone: 98.55–98.80
Long-Term Outlook: Bearish, unless a clear break and close over the resistance zone on the daily or weekly timeframe.
Technically, the momentum indicators remain weak, and the failure to sustain rallies above the 99.00 level also contributes to downward pressure further. The market is now consolidating within a narrow range after steep selling, which suggests probable continuation if macro catalysts are favourable.
Fundamental and Sentiment Drivers
Several macroeconomic and geopolitical drivers are underpinning the weakening of the U.S. dollar:
Federal Reserve Uncertainty:
Speculation over the ultimate fate of Federal Reserve Chairman Jerome Powell under political pressure from the executive branch has severely undermined investor confidence in the central bank’s independence. This has been manifested in increased volatility and bearish pressure on the dollar.
Trade Policy and Tariff Risks:
Ongoing trade tensions, including the possibility of sweeping tariffs (15–20%) on Chinese and European Union goods, have created a risk premium on valuations of the U.S. dollar. Market players still fear retaliation and its effects on trade stability in the world.
Fiscal Position and Credit Ratings:
The US fiscal deficit, which is approaching 7% of GDP, and recent credit rating downgrades to its outlook, have set alarms ringing regarding the structure. These fiscal developments have eroded the popularity of the US dollar as a safe-haven asset, particularly with foreign investors.
Global Monetary Landscape:
With European Central Bank and Bank of Japan maintaining policy guidance tight, and Federal Reserve already indicating that direction for a rate cut in Q4 2025 is being eyed, the falling rate differentials still maintain pressure on the dollar.
Market Outlook: Week of July 21–25, 2025
Major Geopolitical and Economic Events:
DATE : Ongoing
EVENT : U.S.- EU & U.S. — China Trade Negotiations.
MARKET RELEVANCE : High
Resolution or escalation will directly impact USD demand.
DATE : Mid-week
EVENT : Federal Reserve Speeches (including Powell)
MARKET RELEVANCE : High
Monetary policy guidance and institutional stability.
DATE : July 24–25
EVENT : Jobless Claims, Flash PMIs, New Home Sales, Durable Goods Orders
MARKET RELEVANCE : Medium–High
Labour market data, housing data, and production activity have the potential to shift rate expectations and dollar sentiment ahead of the FOMC and PCE releases.
Strategic Implications
Outlook: DXY remains structurally bearish in the short to medium term. Additional weakness below 98.80 and sustained closes below 97.70 would reassert downward momentum, risking a further retracement to the 96.00-95.50 region.
Possible Bullish Reversal Triggers:
A conclusive resolution to U.S. trade negotiations.
Unexpectedly solid economic data (particularly core inflation or employment).
Hawkish Fed commentary supporting policy tightening expectations.
Last thoughts
The U.S. Dollar Index is currently at structurally weak technical and fundamental foundations. Absent a sudden reversal of the monetary policy message or geopolitical resolution, the path of least resistance appears to remain to the lower side. Market participants need to pay special attention to upcoming economic data releases, central bank rhetoric, and trading news because any one of them could be a pivotal driver of near-term dollar behavior.
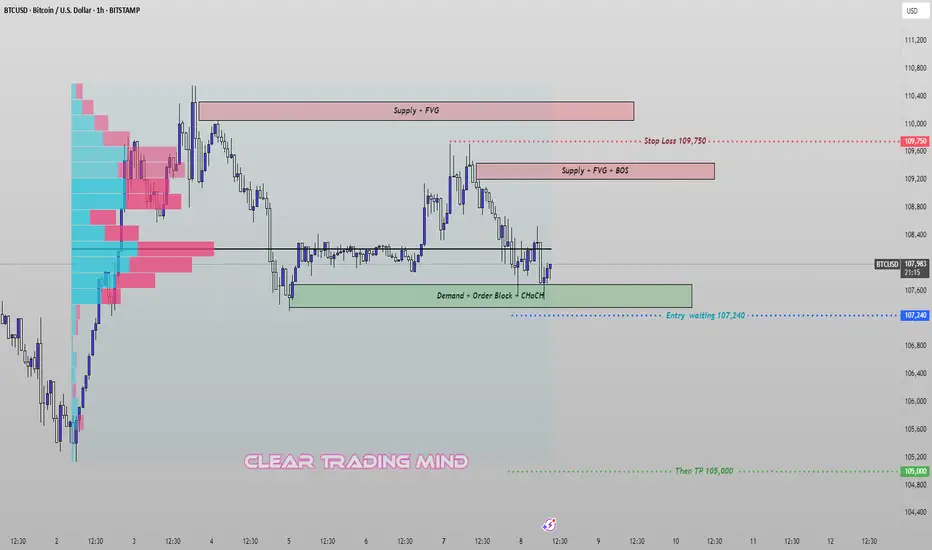
BTCUSD – Breakout Plan from Demand Zone (CHoCH + OB Setup)🔹 Current View:
I'm closely watching the 107,240 zone, where we have a strong Demand + Order Block + CHoCH (Change of Character) setup. This is a key support area that could trigger a fresh bearish move if broken.
🔹 My Plan:
I'm waiting for a clear breakout below 107,240 to enter a short position.
➡️ Entry: 107,240 (after confirmed breakout)
➡️ Stop Loss: 109,750 (above supply + BOS zone)
➡️ Target: 105,000 (previous inefficiency zone)
🔹 Supply Zones Noted:
- 109,250–109,500: Supply + FVG + BOS
- 110,000–110,500: Strong Supply + FVG
This trade is based on price breaking demand structure and retesting key supply areas above. Volume profile also shows heavy activity above, indicating possible resistance on any pullbacks.
BTC TOP AND BEARISH AND CONTUNITY PREDICTION This chart is purely based on technical analysis. The RSI is still not oversold on the monthly chart, which means there might be a little more upside to this. But from the trendline, a serious reversal appears due. I could be wrong, but we'll all see. Profit taking may commence bit by bit.
XAUUSD SELL ANALYSIS SETUP READ (CAPTION)hi trader's. what do you think about gold
current price: 3293
gold is breakout low 3289 in (H1) candle pettran and now gold resistance zone 3295 and 3308 and gold is reject this area and create sell candle then gold fall down
resistance zone: 3295-3308
target : 3270-3250
stop loss: : 3310
please don't forget to like comment and follow thank you

ARE WE IN A BEAR MARKET, AT WHAT EXTENT?In this video, I attempt to explain the fractal similarities in the gold market five years apart and how we can use a best-fit model to predict the next stage of the current correction.
In the next video, I will investigate the results of our model.
Check back shortly

Nifty is Bearish for next week. But Why ? "Ask me in comments".Nifty is facing resistance at this level for a specific reason. this week it can be bearish and continue to go down side.

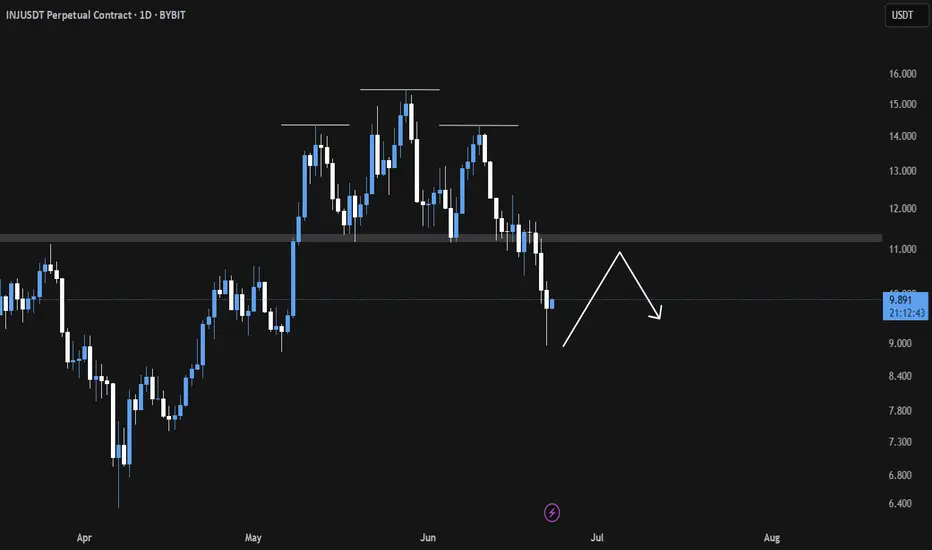
INJ Breakdown in Play Eyeing the Neckline for Precision ShortsINJ/USDT Analysis
〽️ The Head and Shoulders pattern has broken down successfully, confirming a bearish structure.
💠We anticipate a potential relief bounce towards the $11 region which aligns closely with the neckline retest zone. This area is likely to act as a liquidity trap, where institutional sellers may re-enter aggressively 👀.
🎯 Key downside targets remain at
1. $8.98
2. $8.03
3. $6.92
Strategic Plan 🎖️
Look to initiate short positions around the neckline retest near $11, as the risk-reward becomes increasingly favorable from that level.
Trade with discipline. Let the structure lead the execution. 🫡🧠
Bitcoin (BTC/USDT) – Bearish Breakdown in Play (4H)BTC has lost key support at $103,573 on the 4-hour timeframe, breaking down from the recent consolidation zone. The rejection from the lower highs and weakening RSI suggest more downside pressure ahead.
Technical Breakdown:
Support Broken: $103,573 (now acting as resistance)
Current Price: $102,246
Next Key Support Zones:
$101,410 (short-term bounce zone)
$97,340 – critical horizontal support
$93,343 – potential deeper flush area
Resistance to Watch:
$103,573 (retest = short opportunity)
$105,807 (major rejection zone)
Short Setup (Signal Style):
Short Entry: ~$103,500 (if retested)
Stoploss: Above $105,800
Targets:
TP1: $101,400
TP2: $97,300
TP3: $93,300
Final Note:
Trend remains bearish below $103.5K. Bulls need to reclaim that level fast or further downside becomes likely.
Not financial advice. DYOR.
