Gold Hits Fibonacci 3.618! What’s Next?GOLD (XAU/USD) Quick Analysis – April 2025
Gold just surged to $3,329/oz, reaching the Fibonacci 3.618 extension around $3,338 🚀
The trend remains strongly bullish, but the price is now extended far above key moving averages – signaling potential exhaustion.
Key Levels:
Support: $2,856 (Fibo 2.618)
Next Resistance: $3,635 (Fibo 4.236)
🧭 Outlook:
As long as price holds above $2,856 → the bullish structure remains intact
🎯 Strategy:
Wait for a healthy pullback → buy the dip near support
Or enter on a breakout-retest above $3,338 for potential continuation
Bearish Trend Line
#NEIROETHUSDT maintains bearish momentum❗️Keep an eye on the BYBIT:NEIROETHUSDT.P — the structure suggests a possible local rebound or a breakout of the wedge to the upside. Opening a short here goes against the structure and lacks confirmation
📉 SHORT BYBIT:NEIROETHUSDT.P from $0.01612
🛡 Stop loss $0.01693
🕒 Timeframe: 1H
✅ Overview:
➡️ The chart shows BYBIT:NEIROETHUSDT.P forming a bearish continuation move after breaking out of a consolidation range.
➡️ Entry at $0.01612 corresponds to a retest of former support turned resistance.
➡️ Selling volume is increasing, supporting bearish pressure.
➡️ The POC level at $0.02084 remains far above the current price, highlighting downward imbalance.
🎯 TP Targets:
💎 TP 1: $0.01586
💎 TP 2: $0.01535
💎 TP 3: $0.01500
📢 Additional scenario notes:
📢 A false breakout above the entry zone is possible — wait for confirmation of the $0.01620 break.
📢 Watch for volume spikes near TP1 and TP2 — could signal partial take profits.
📢 If price reclaims $0.01693, the setup becomes invalid.
🚀 BYBIT:NEIROETHUSDT.P maintains bearish momentum — downside move expected!
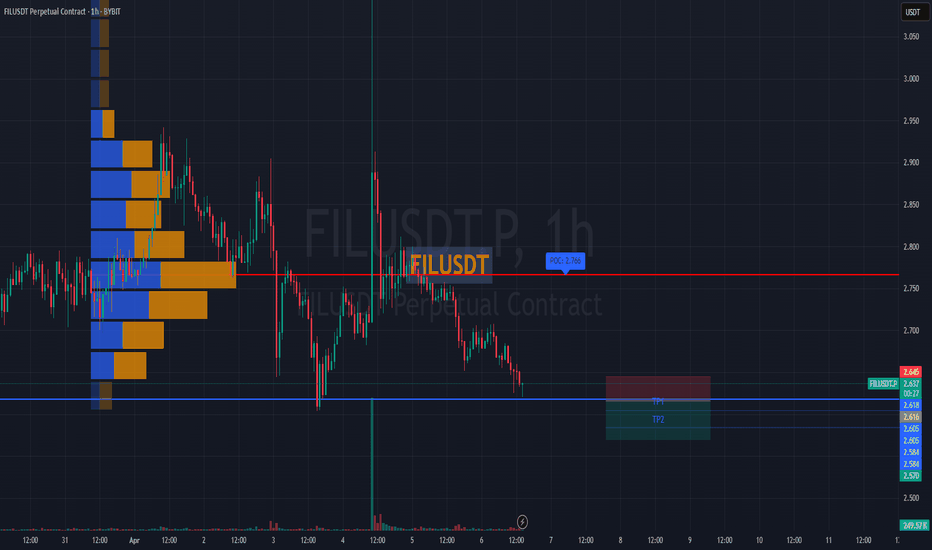
#FILUSDT remains under bearish pressure📉 SHORT BYBIT:FILUSDT.P from $2.616
🛡 Stop loss $2.645
🕒 1H Timeframe
⚡️ Overview:
➡️ The POC (Point of Control) BYBIT:FILUSDT.P is located at $2.766, far above the current price — this highlights strong historical selling pressure.
➡️ Price is forming lower highs and lower lows, confirming a bearish trend.
➡️ The breakdown below $2.616 triggered the short setup with further downside potential.
➡️ Volume spikes during red candles indicate continued seller activity.
🎯 TP Targets:
💎 TP 1: $2.605
💎 TP 2: $2.584
💎 TP 3: $2.570
📢 Watch the $2.616 zone — holding below increases downside probability.
📢 If price moves above $2.645, the setup becomes invalid.
BYBIT:FILUSDT.P remains under bearish pressure — short bias stays valid under current structure.
Bearish pressureADA/USDT – Price Action Analysis
On the 1-hour timeframe, price has been following a clear downtrend, respecting a descending channel structure. After reaching the lower boundary, sellers lost some momentum, and price started to form a rising wedge, typically seen as a bearish continuation pattern in such contexts.
Currently, price is testing a key confluence zone:
The upper boundary of the wedge
The descending trendline resistance
And also sitting below the dynamic resistance of the 200 EMA.
From a price action perspective:
Bullish candles are showing limited strength and upper wicks indicate selling pressure.
A confirmed breakdown below the wedge support could lead to further downside towards the previous demand area around 0.6550 - 0.6340.
#AI16ZUSDT remains in a bearish momentum
📉 SHORT BYBIT:AI16ZUSDT.P from $0.1544
⚡️ Stop loss $0.1582
🕒 Timeframe: 1H
✅ Overview BYBIT:AI16ZUSDT.P
➡️ Price continues in a downtrend, breaking key support levels.
➡️ POC: $0.1615 marks a high-volume area where price was rejected, indicating strong selling pressure.
➡️ Resistance at $0.1582 — expect rejection on retest.
➡️ Entry zone: $0.1544, but wait for confirmation before entering!
➡️ Targeting TP1: $0.1510 and TP2: $0.1485 on further downside movement.
📍 Important Note: Watch for confirmation levels before entering! Do not enter too early.
🎯 Take Profit Targets:
💎 TP 1: $0.1510
💎 TP 2: $0.1485
⚡️ Plan:
➡️ Wait for confirmation before entering at $0.1544.
➡️ Stop loss $0.1582 — above resistance.
➡️ Take profits at $0.1510 and $0.1485.
🚀 BYBIT:AI16ZUSDT.P remains in a bearish momentum — follow the plan after confirmation!
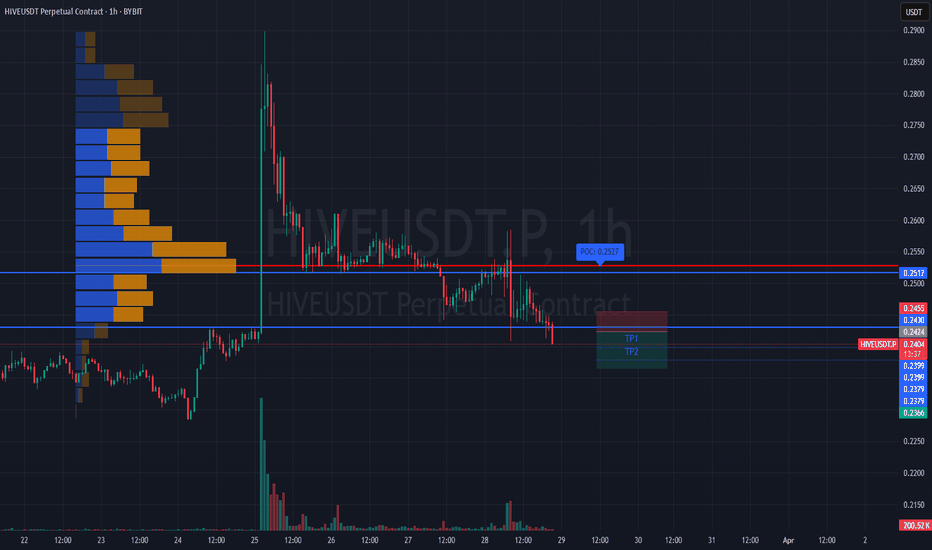
#HIVEUSDT is maintaining a bearish structure📉 Short BYBIT:HIVEUSDT.P from $0.2424
🛡 Stop loss $0.2455
🕒 1H Timeframe
⚡️ Overview:
➡️ The POC (Point of Control) is at 0.2527, marking the area with the highest trading volume and now acting as major resistance.
➡️ The 0.2455 level serves as local resistance — price has already started to decline from that zone.
➡️ Price BYBIT:HIVEUSDT.P is steadily moving lower and staying below volume clusters, confirming the bearish structure.
➡️ A breakdown below $0.2424 could lead to acceleration toward target zones.
🎯 TP Targets:
💎 TP 1: $0.2399
💎 TP 2: $0.2379
💎 TP 3: $0.2366
📢 Watch for confirmation of the $0.2424 breakdown — it’s key for continuation.
📢 If price reclaims $0.2455, the short setup becomes invalid.
BYBIT:HIVEUSDT.P is maintaining a bearish structure — expect quick target reaction if the signal confirms.
#GPSUSDT is forming a bearish structure📉 Short BYBIT:GPSUSDT.P from $0.02888
🛡 Stop loss $0.02952
🕒 1H Timeframe
⚡️ Overview:
➡️ The main POC (Point of Control) is at 0.03326, marking the highest volume zone and a major resistance above the current price.
➡️ The 0.02952 level acts as local resistance and an ideal stop placement.
➡️ Price BYBIT:GPSUSDT.P has already tested the $0.02888 support — a confirmed breakdown could trigger stronger downward momentum.
➡️ Volume is increasing on the decline, supporting the sellers' pressure.
🎯 TP Targets:
💎 TP 1: $0.02850
💎 TP 2: $0.02810
💎 TP 3: $0.02787
📢 Watch for a clean break of the $0.02888 level — it could be the entry trigger for this short setup.
📢 If price pulls back above $0.02952, the short scenario becomes invalid.
BYBIT:GPSUSDT.P is forming a bearish structure — continuation to the downside is expected if support fails.
Perfect Bearish Setup Trendline Breakout Alert!Hello Trader! 👋
Scenario 1: 📉
Picture this: You're analyzing a solid bearish trend on the M3 or H1 chart, and you've just spotted a trendline break with serious potential for a sell opportunity. 🔥 The momentum is strong, and everything aligns perfectly. 🚀 The market is pushing lower, and it looks like it’s ready to move further down.
The entry signal is solid, confirming a valid opportunity to take a short position! 📉
Now, the exciting part—the target zone! 🎯 We’re eyeing a liquidity area around 3000, which is a key level where price could see some action. 🔄 But wait, there's more! Your secondary target level is around 2990, which could offer even more potential for profit as the market drives lower. 💰
Of course, always follow your risk management**—control your position size, set your stops wisely, and let the market do the work! 🛑⚖️ Trading is all about discipline , and with the right mindset, you'll maximize those winning moves. 🏆
Stay focused, keep an eye on the price action, and be ready to react! 💪 Let’s trade smart and make those profits! 😎💥
Wednesday Market Outlook: Bearish Trend Expected📉 Wednesday Market Outlook: Bearish Trend Expected
Tuesday’s price action played out as expected, confirming my bias. While price didn’t fully tap into my POI before the rally, the movement remains valid.
---
📊 Wednesday’s Forecast
For Wednesday, I’m expecting:
✅ Monday’s high to be taken out
✅ Tuesday’s high to be taken out
✅ Price to reach my bearish POI at 1.29794
From there, I’ll be looking for a drop to 1.28835.
---
📉 Overall Bias: Bearish
Given this setup, I’m maintaining a bearish stance for Wednesday. Now, it’s all about patience and execution.
Let’s see how price unfolds. Are you bullish or bearish this week? Drop your thoughts below! 👇🏾
join our community for more market insights.
#Forex #MarketOutlook #TradingPlan #GBPUSD
Bearish Outlook for ENA: Potential Downward TrendHello everyone! 👋
I hope you're all doing well. I wanted to share my thoughts on ENA and provide my perspective on the current market situation. Here's my outlook:
The price of this coin is exhibiting signs of weakness, suggesting it may face further downward pressure. Recent price action has broken through key support levels, while momentum indicators are pointing to a continuation of the prevailing downtrend.
If the broader market sentiment remains negative, we could see further declines toward the next major support zones. While potential rebounds are always a possibility, the overall trend currently appears to favor the bears.
Stay vigilant and manage your risk accordingly.
Best regards! BINANCE:ENAUSDT
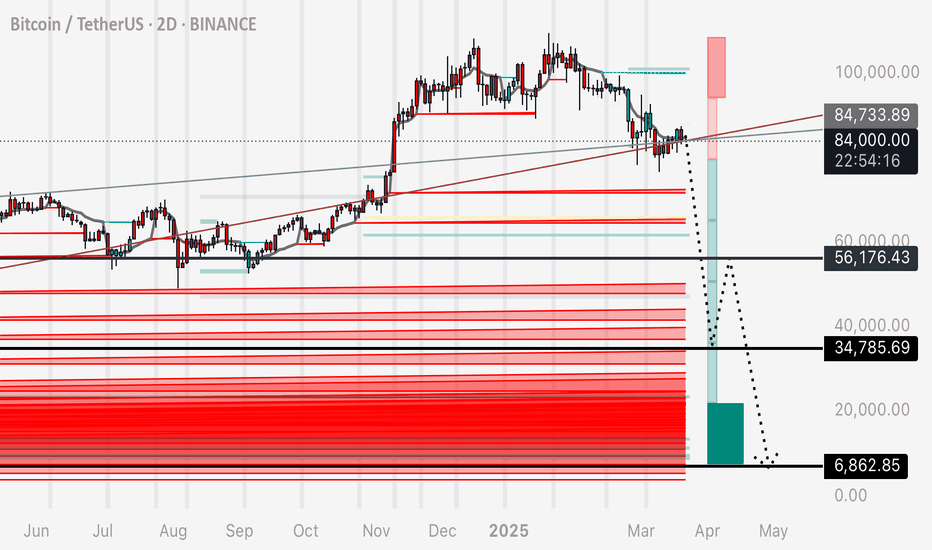
BTC - ABC Correction to Absorb Long Liquidity Further to my previous recent post, I wanted to highlight two indicators that accurately present us with liquidity on the BTC chart.
Connecting the pieces of the puzzle of this prediction - this ABC correction pattern allows the market to absorb the Long position liquidity left in tact on the chart.
Since these long positions leave a trail of leveraged sell orders (stop losses) - we should expect a mass chain reaction of these orders setting off one into the next, with increasing speed and momentum of the drop.
We do not need a black swan event for this to occur. The orders are already in the chart to allow it to happen, as an adverse consequence to open interest and open traders positions during the last 2 years.
There is many confluences to support this correction pattern, if interested in learning more, see my previous posts on Trading View.
Enjoy!
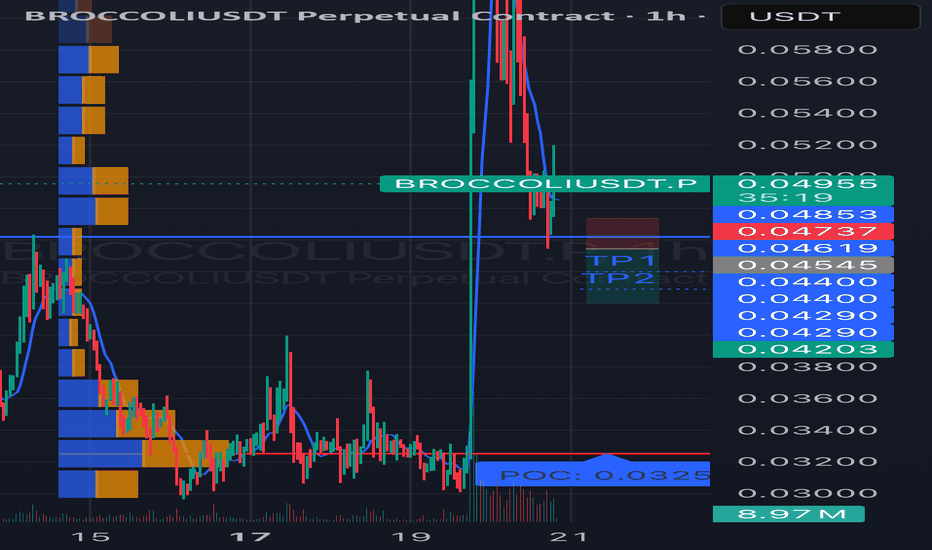
#BROCCOLIUSDT is showing bearish potential SHORT BYBIT:BROCCOLIUSDT.P from $0.04545
🛡 Stop Loss: $0.04737
🕒 Timeframe: 1H
⚡️ Overview:
➡️ BYBIT:BROCCOLIUSDT.P is showing bearish momentum on the 1-hour timeframe after a significant drop from $0.06000 to the current consolidation zone of $0.4203–$0.4885.
➡️ The price recently tested the $0.04545 level (a possible retest of a broken support, now acting as resistance), which could serve as an entry point for a short.
➡️ The volume profile on the left shows strong buyer interest at $0.0325 (POC), which acts as a key support level. However, the lack of significant buying volume at current levels suggests potential for further downside.
➡️ The price structure remains bearish: lower highs and lows are forming after the drop.
➡️ The RSI (14) indicator on the 1H timeframe is presumably around 45 (based on price action), indicating neutral momentum with room for a downward move.
🎯 Take Profit Targets:
💎 TP 1: $0.04400
💎 TP 2: $0.04290
💎 TP 3: $0.04203
⚡️Plan:
➡️ Entry: Sell below $0.04545 after the 1-hour candle closes below this level to confirm the rejection from resistance.
➡️ Stop Loss: Set at $0.04737, which provides a 7% risk from the entry point and protects against a potential breakout.
➡️ Risk/Reward Ratio: From 1:2 (for TP1) to 1:5 (for TP3), making this trade attractive from a risk management perspective.
➡️ After the drop, the price has stabilized, indicating possible consolidation or accumulation.
➡️ Resistance zone: $0.04885 (upper boundary of the current range).
Technical Indicators:
➡️ The chart shows candles in red and green, reflecting bearish and bullish movements.
➡️ After the sharp decline, the price has formed lower highs and lows, but in recent hours, there’s an attempt at recovery.
📢 A price rejection below $0.04545 with increasing selling volume increases the likelihood of reaching the targets.
📢 The $0.04400 and $0.04290 levels may act as areas for partial profit-taking, so monitor price action in these zones.
📢 Risks: If the price breaks above $0.04885, it could signal a false breakdown and a potential reversal to the upside. In this case, consider reassessing the position.
📊 The decline in BYBIT:BROCCOLIUSDT.P aligns with cautious sentiment in the crypto market.
📊 As of March 20, 2025, BYBIT:BTCUSDT.P is trading around $90,000, showing signs of consolidation, which may pressure altcoins like BYBIT:BROCCOLIUSDT.P
BYBIT:BROCCOLIUSDT.P is showing bearish potential on the 1H timeframe.
⚡️A confirmed rejection below $0.04545 is your signal to act!
WILL GOLD FALL OR RISE IN FOMC SPEAKS ALERT!Hey Trader
there is market going to buy trend and powell speaks at in 2 hour left so if market break NEW ATH with good buy momentum before powell speaks so you see GOLD fall and target area for BEAR side
3000 and 2980
if the ATH break and close above m30 candel so you see gold mark new ATH at 3070
key level or reversal:
3046 for seller
3000 for buyers
follow risk mangement
#AVLUSDT continues its downtrend 📉 Short BYBIT:AVLUSDT.P from $0,4060
🛡 Stop loss $0,4136
🕒 1H Timeframe
⚡️ Overview:
➡️ The main POC (Point of Control) is 0,4201
🎯 TP Targets:
💎 TP 1: $0,4015
💎 TP 2: $0,3975
💎 TP 3: $0,3945
📢 Monitor key levels before entering the trade!
BYBIT:AVLUSDT.P continues its downtrend — watching for further movement!
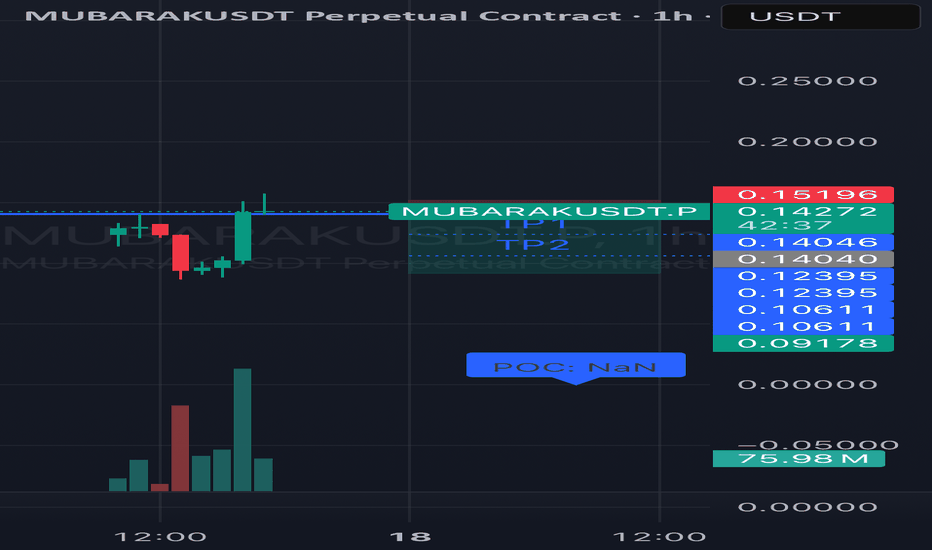
#MUBARAKUSDT continues its downtrend📉 Short BYBIT:MUBARAKUSDT.P from $0,14040
🛡 Stop loss $0,15196
🕒 1H Timeframe
⚡️ Overview:
➡️ The main POC (Point of Control) is Nan
🎯 TP Targets:
💎 TP 1: $0,12395
💎 TP 2: $0,10611
💎 TP 3: $0,09178
📢 Monitor key levels before entering the trade!
BYBIT:MUBARAKUSDT.P continues its downtrend — watching for further movement!
#BANANAUSDT maintains bearish momentum📉 Short BYBIT:BANANAUSDT.P from $14.905
🛡 Stop loss $15.490
🕒 1H Timeframe
⚡️ Overview:
➡️ The main POC (Point of Control) is at 16.112, indicating the area with the highest trading volume.
➡️ The 15.490 level acts as a local resistance, as the price previously faced selling pressure there.
➡️ The volume and market profile highlight areas of high trader activity, especially in the 14.250 – 15.500 range.
➡️ The chart shows a potential decline after an impulse move and profit-taking.
🎯 TP Targets:
💎 TP 1: $14.580
💎 TP 2: $14.250
💎 TP 3: $13.920
📢 Monitor key levels before entering the trade!
📢 If 15.490 is broken upward, the trade may be invalidated.
📢 If the price continues to decline and breaks through TP 1, the downside potential remains.
BYBIT:BANANAUSDT.P maintains bearish momentum — expecting further downside movement!
BTC 12000-19000 ?!!! Possibly yes...If BTC falls below $49,000, we could see a major drop to the $12,000 - $19,000 range! This level is a critical support, and losing it could trigger a cascade of liquidations.
📉 Watch for confirmation and manage your risk accordingly!
💭 What are your thoughts? Bullish or bearish? Let’s discuss!
#Bitcoin #BTC #Crypto #Trading #CryptoMarket #Bearish #Bullish
Let me know if you want any tweaks! 🚀
BTC - Watch this Trendline - Potential Short to 36,000I’ve drawn the main trendline and marked the contact points in red circles if you’d like to replicate this on your own chart
I’ve also demonstrated that when the correct trendline is identified, it can be duplicated and placed at different points on the chart that price seems to follow - IE support / resistance works on a diagonal grid
I’ve marked my personal entry in green, stop loss in red - minor targets in grey dashed lines and major targets in black solid lines
Fundamentally this drop makes sense as there is a mass amount of liquidity in these below zones.
Not financial advice, do your own research and experimentations.
God speed!
#TRUMPUSDT – Bearish Scenario, Breakout Down📉 SHORT BYBIT:TRUMPUSDT.P from $12.278
🛡 Stop Loss: $12.599
⏱ 1H Timeframe
⚡ Trade Plan:
✅ The BYBIT:TRUMPUSDT.P price has formed a Bearish Flag and broke its lower boundary, confirming a bearish scenario.
✅ The asset is trading below POC (Point of Control) at $12.978, indicating strong seller dominance.
✅ Increasing volume on the breakdown further confirms the strength of the downward move.
🎯 TP Targets:
💎 TP 1: $12.100
🔥 TP 2: $11.900
⚡ TP 3: $11.785
📢 A close below $12.278 would confirm further downside movement.
📢 POC at $12.978 is a strong resistance level that the price failed to break.
📢 Increasing volume on the drop supports the bearish outlook.
📢 Securing partial profits at TP1 ($12.100) is a smart risk-management strategy.
🚨 BYBIT:TRUMPUSDT.P remains in a downtrend – monitoring for continuation and securing profits at TP levels!
#CAKEUSDT – Bearish Scenario, Expecting a Breakdown📉 SHORT BYBIT:CAKEUSDT.P from $2.030
🛡 Stop Loss: $2.058
⏱ 1H Timeframe
⚡ Trade Plan:
✅ The BYBIT:CAKEUSDT.P price previously formed a Falling Wedge pattern and three bottoms (Bottom 1, Bottom 2, Bottom 3), followed by a bounce.
✅ However, the asset is trading below POC (Point of Control) at $2.504, which acts as strong resistance. If the price fails to hold above the current levels, a downward continuation is likely.
🎯 TP Targets:
💎 TP 1: $2.008
🔥 TP 2: $1.986
⚡ TP 3: $1.970
📢 A close below $2.030 would confirm further downside movement.
📢 POC at $2.504 is a key volume area acting as resistance.
📢 Increasing volume on the decline signals strong seller activity.
📢 Taking partial profits at TP1 ($2.008) is a smart risk-management strategy.
🚨 BYBIT:CAKEUSDT.P remains under selling pressure – monitoring for confirmation and securing profits at TP levels!


