CADJPY Successful Live tradeI am providing an update on the ongoing CADJPY sell trade. All the confirmation levels have aligned in favour of the short position, validating our initial analysis.
As anticipated, the price swiftly broke below the 1dh (one-day high) and continued its downward movement, breaching the structure (4). This development confirms the bearish momentum in the market.
The trade was eventually closed out at the trail stop, coming just 5 pips short of reaching the initial target. While the trade did not fully achieve our desired outcome, it still resulted in a profitable exit.
Additionally, I have conducted analyses on the GBPUSD, AUDUSD, and USDJPY currency pairs. These analyses provide valuable insights into their respective market conditions and potential trading opportunities.
Wishing you continued success!
Bearmarket

NDX fantastic short opportunityI have to admit, most, if not all, Elliott Wavers were shot in the head this year with the rising market. Personally, I was caught off guard by the strong upmove too. For any EW and macro speculator, the upmove in 2023 don't make sense. It is irrational. In fact, it could be irrational exuberance again. But as time passes, the truth starts to unfold: the market capitalisation weighted indices were really being upheld by a few names. The rest were really flat or down. What this means is that the market breadth is not there for this rally. And this is something that is peculiar to this market because of the high market cap of a handful of companies. I don't think the original creator of the index thought that this could happen, but it did.
Nevertheless, I would admit that this is really another bold attempt to call a market top (or really, a correction top).
Disregarding EW technique which is either hated or loved, just look at the risk-reward for this trade. It doesn't make sense to go long, if this is the only rationale a trader needs to decide which side to trade on.
Good luck!

ETH 90% Downtrend What if we are just in Eth denial phase, in the middle of a massive downtrend?
At the moment Eth seems to be drawing an huge bear flag.
Still remember last bear market a fall from 1500 to 75 dollars. 90% drop.
Why would it be different now?
ETH Foundation sold 15.000 ETH this month and they normally sell it at local tops.
It looks like 3 digits on the horizon.
Good luck!

BTC - Big move coming! Watch the neckline! The volume is very low at the moment! This indicates a bigger move is coming!
Last time the volume was this low, the price went from 40k to 27k in only two days!
When meme coins start pumping, you know the overall rally is coming to an end. We are exactly in that phase, in my opinion. Memecoins have recently been pumping while the overall market has shown significant weakness.
I suggest that everyone stay away from Altcoins as the BTC dominance is expected to climb higher!
After examining the chart, it appears that the price of BTC is forming a head-and-shoulders pattern, which is typically indicative of a weakening trend. If the price breaks below the neckline, it will most likely fill the fair value- and CME gap.
Additionally, the current market period seems to follow a similar pattern to the one observed in 2021, suggesting that the market may experience a downward movement that could lead to a decline in value to 13.5k. While history doesn't always repeat itself, it's worth noting that historical patterns tend to rhyme with the present.
Moreover, the price of Bitcoin was recently rejected from the bear market downtrend resistance, indicating a potential move to the previous bottom of $15.5k, which is consistent with the concept of the price following a pattern reminiscent of the 2021 summer period. It's also worth mentioning that the S&P 500 has been showing some weakness, and since BTC typically moves in lockstep with the S&P 500, it can be prudent to monitor its movement.
The bear market probability index is currently at an all-time high, which suggests that the ongoing rally could be considered the biggest bull trap ever witnessed in the history of Bitcoin. While relying on a solitary model is insufficient for drawing definitive conclusions, numerous indicators suggest a downward price trend in this case.
Lastly, the market is experiencing a notable increase in fear, likely due to multiple factors simultaneously impacting the market. Based on historical precedent, it is reasonable to anticipate significant downward market movements should prior trends repeat themselves.

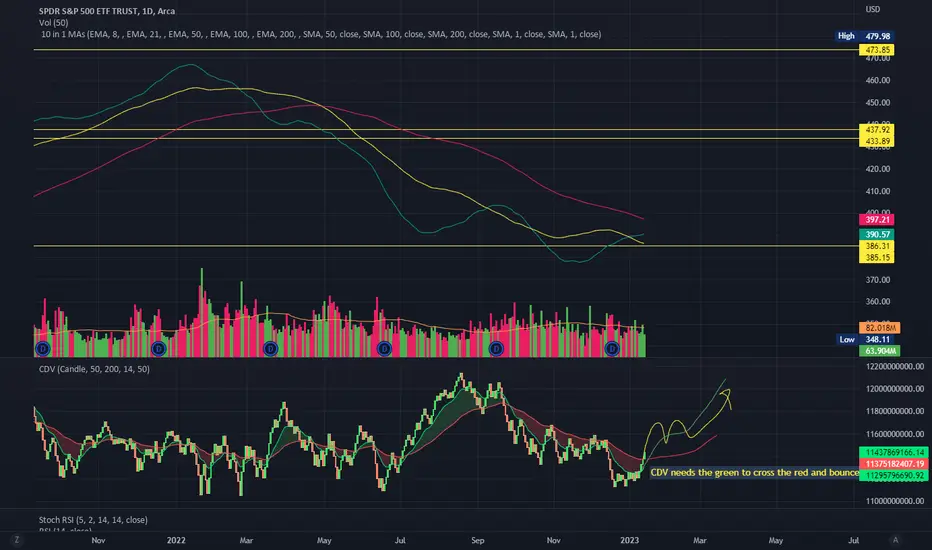
SPY bull market using SMA and CDVIs this a sign of the end of a bear market?
SMA 50 is cutting above SMA 100 and SMA 100 looking flat based on Adam Khoo theory.
The SMA 200 has yet to slope upwards (once this is confirmed upwards new bull market is confirmed).
Some experts believed that in order to signal end of a bear market the VIX has to hit above the reading of 40 before it begins to signal end of bear market.
So far it has not. Let's observe.
What does a bear market look like?“A bear market starts with greed, followed by confusion, sells on fear and ends with hopelessness” - By me!
'Bull markets are born on pessimism, grown on skepticism, mature on optimism, and die on euphoria." - John Templeton
Apply this bear to bull transition with good market sense because some of the bears went into hibernation, not able to wake up at all, for example the recent collapsed of some banks.
Able to recognize at what stage the market is… at any particular point helps me to determine whether to take on the market with some risks or not at all.
Reference of Bitcoin Trading:
CME Bitcoin Futures
Minimum fluctuation
$5.00 per bitcoin = $25.00
BTIC: $1.00 per bitcoin = $5.00
CME Micro Bitcoin Futures
Minimum fluctuation
$5.00 per bitcoin = $0.50
BTIC: $1.00 per bitcoin = $0.10
Disclaimer:
• What presented here is not a recommendation, please consult your licensed broker.
• Our mission is to create lateral thinking skills for every investor and trader, knowing when to take a calculated risk with market uncertainty and a bolder risk when opportunity arises.
CME Real-time Market Data help identify trading set-ups in real-time and express my market views. If you have futures in your trading portfolio, you can check out on CME Group data plans available that suit your trading needs www.tradingview.com

High Risk for the Coming WeekExpectation is the white path, if we breakdown around June 9th then it will tank to 3700s by end of June
If downside isn’t explosive and takes longer than end of June it will likely bounce (dashed path)
Max upside I see is 4310 but it has the setup to drop from here directly on a sell the news June 1st when debt ceiling gets raised
Any delay in a deal will be bad. I think the NASDAQ is going to lead the way down due to its increasingly unstable setup

BTC: Price action is getting tight!The price has undergone multiple retests of the lower boundary of the triangle formation, indicating a weakening trend! Considering the upward momentum observed in the DXY, a break below the triangle formation is expected. In such an event, it is anticipated that the price will reach a minimum of 24.8k. However, if the DXY continues its upward momentum and the stock markets experience further declines, it is conceivable that additional downward movement beyond that level may ensue!

BTC - Bearish retest of the neckline!It is apparent that the price has breached below the neckline and subsequently undergone a bearish retest. However, the price has failed to regain the neckline, indicating a potential shift in momentum toward the downside. Should the price further break below the support zone, there is a strong possibility of moving toward the 24k mark.
Furthermore, it should be mentioned that the volume is currently very low! This indicates a more significant move is coming!
Last time the volume was this low, the price went from 40k to 27k in only two days!
When meme coins start pumping, you know the overall rally is coming to an end. We are precisely in that phase, in my opinion. Memecoins have recently been pumping while the overall market has shown significant weakness.
I suggest everyone avoid Altcoins as the BTC dominance is expected to climb higher!
Moreover, the price of Bitcoin was recently rejected from the bear market downtrend resistance, indicating a potential move to the previous bottom of $15.5k, which is consistent with the concept of the price following a pattern reminiscent of the 2021 summer period. It's also worth mentioning that the S&P 500 has been showing some weakness, and since BTC typically moves in lockstep with the S&P 500, it can be prudent to monitor its movement.
The bear market probability index is currently at an all-time high, which suggests that the ongoing rally could be considered the biggest bull trap ever witnessed in the history of Bitcoin. While relying on a solitary model is insufficient for drawing definitive conclusions, numerous indicators suggest a downward price trend in this case.
Lastly, the market is experiencing a notable increase in fear, likely due to multiple factors simultaneously impacting the market. Based on historical precedent, it is reasonable to anticipate significant downward market movements should prior trends repeat themselves.

BTC - The volume is extremely low! A big move is coming!The volume is very low at the moment! This indicates a bigger move is coming!
Last time the volume was this low, the price went from 40k to 27k in only two days!
After examining the chart, it appears that the price of BTC is forming a head-and-shoulders pattern, which is typically indicative of a weakening trend. If the price breaks below the neckline, it will most likely fill the fair value- and CME gap.
Additionally, the current market period seems to follow a similar pattern to the one observed in 2021, suggesting that the market may experience a downward movement that could lead to a decline in value to 13.5k. While history doesn't always repeat itself, it's worth noting that historical patterns tend to rhyme with the present.
Moreover, the price of Bitcoin was recently rejected from the bear market downtrend resistance, indicating a potential move to the previous bottom of $15.5k, which is consistent with the concept of the price following a pattern reminiscent of the 2021 summer period. It's also worth mentioning that the S&P 500 has been showing some weakness, and since BTC typically moves in lockstep with the S&P 500, it can be prudent to monitor its movement.
The bear market probability index is currently at an all-time high, which suggests that the ongoing rally could be considered the biggest bull trap ever witnessed in the history of Bitcoin. While relying on a solitary model is insufficient for drawing definitive conclusions, numerous indicators suggest a downward price trend in this case.
Lastly, the market is experiencing a notable increase in fear, likely due to multiple factors simultaneously impacting the market. Based on historical precedent, it is reasonable to anticipate significant downward market movements should prior trends repeat themselves.

Which Scenario ?Just by looking at it it makes sense for price to hunt all those untouched liquidity , right ?
but what's gonna happen next ?
as i indicated here there are 4 scenarios for me , but i think 4 is the most possible one , why u ask ?
well , if u follow my ideas i am bearish on BTC and i have a whole bunch of reasons and all i see here and in the recent move was just a liquidity hunt .
i predict prices bellow 25K for BTC cause i yet recognize exhaustion in price move , and it is not a good sign if u want to see a bull run ...
so yeah , here it is , make ur own judgment .

Wells Fargo $WFC going for a dive, 2.6 R:R short I'm looking fornot a financial advice, my position based on my analysis and bias.

$BTC #Bitcoin Quarterly Moving AveragesUnfortunately, despite what I would personally love to believe and what you might believe, we are still very much in a bear market. You can see in this chart that in any bull market, we remained above the 720 Day MA. As of now we have not been able to get back above it. The positive note here is that the lower timeframe MA's have all begun to cross upward, to hopefully move back above the 720D, but until price and the lower timeframe MA's move above it, we will not be in a true bull market and can expect a revisit of the lows. IMO
NFA
DYOR
#AirCoin

AUD/USD BEARISH PRICE ACTIONDo you see what I see?. A beautiful Head and shoulder in the day chart. This is a long term trade. So be patient. Soon or later the price will reach to the bottom 0.6300.
Sell AUD/UDS.
Safe trade!

Double Top Pattern on Golden Pocket I would like to draw your attention to an intriguing technical pattern that has formed on the charts: the Double Top Pattern on the Golden Pocket. This pattern combines the classic Double Top formation with Fibonacci retracement levels of 0.618 and 0.65, creating a potentially significant trading opportunity.
A double top pattern is a bearish reversal pattern that occurs after an uptrend. It consists of two price peaks that reach a similar level, separated by a valley known as the neckline. The double top pattern suggests a weakening of the bullish momentum, indicating a potential trend reversal to the downside.
Now, let's incorporate the Golden Pocket concept into this pattern. The Golden Pocket refers to Fibonacci retracement levels of 0.618 and 0.65, which are significant areas where price retracements often find support or resistance. When a double top pattern coincides with these Fibonacci levels, it adds an extra layer of confluence and increases the pattern's potential significance.
The combination of the double top formation and the Golden Pocket suggests that the market may experience increased selling pressure around these levels. Traders could consider this as a potential opportunity to enter short positions, anticipating a downward move in price.
To take advantage of this setup, here's a suggested trading plan:
1. Identify the double top formation with clear swing highs and the neckline.
2. Confirm the presence of the Fibonacci retracement levels of 0.618 and 0.65 coinciding with the double top.
3. Wait for a bearish confirmation signal, such as a close below the neckline or a breakdown of a significant support level.
4. Place a stop loss above the second peak of the double top to manage risk.
5. Set a profit target based on your risk-reward ratio or previous support levels.
Remember, as with any trading strategy, it is essential to conduct proper risk management, use appropriate position sizing, and consider other technical and fundamental factors that may affect the market.
Keep a close eye on price action and be ready to adapt your strategy based on market developments. Trading involves risk, and it's crucial to stay disciplined and adhere to your trading plan.
Wishing you successful trading,
Sailortrades

CRYPTO projection for 2023Starting from june i think Bitcoin will start going down , and will drag market cap to the downside.
Until february 2024 i think market cap of crypto is going to tap in to that 175 billion region.
Things are not looking good for bitcoin right now , i think bitcoin is going to revisit 30k level and then start plummeting to the downside .

EUR/AUD SHORT PRICE ACTIONThais pair may take a while before breaking out of the consolidation zone. I can see a bearish flag is forming, as you can see. so I'm expecting a down trend after that. still early to confirm my analysis, so keep watching for potential short. If the bearish flag formed well then target the areas I marked.
Trade safe!

EUR/USD BEARISH PRICE ACTIONbears are pushing hard. I'm expecting the price to reached the range I specified in the chart around 1.07. I'm selling this pair to the target specified.


BTCUSDT - has bull market really been started? Hello, dear friends!
Bitcoin has approached to the critical price level where most of traders are struggling to define if now still the bear market or the bull market has been already strated. In today's article we will try to bring together many facts and make the conclusion about what is coming next. Let's go!
BEAR MARKET STRUCTURE
I have see many opinions that bear market has been started on November 2021, but I suppose it has started much earlier - in April 2021. My first evidence of this assumption is that maximum euphoria was in April, where we saw the largest altseason ever. Remember, many altcoins made 10-100x in those period. After OKX:BTCUSDT faced with the corrective move in wave A. The wave B was very tricky, it broke through the previous ATH which made a lot of traders confused. But in November 2021 only BTC and fundamental altcoins set the new ATH, like ETH, ATOM and DOT. So-called "shitcoins" demonstrated very weak pump and retraced only to 0.61 Fibonacci. To sum up this part of analysis, I consider now Bitcoin is finishing the wave C before the new bull market.
WAVE C STRUCTURE
Our main purpose now is to anticipate where the wave C could be ended to invest in crypto. Wave C should consists of 5 waves. Awesome oscillator is our best tool to identify the waves. The minimum AO value corresponds to the wave 3 bottom. Yes, It was at $17500, not at $15500. In my opinion, wave 4 has the shape of complex correction - very tricky one for all traders. I suppose that wave 4 has been finished in two reasons: BTC reached the 0.38-0.5 Fibonacci area and AO crossed the zero line.
WHAT IS THE BEAR MARKET TARGET PRICE?
I consider the wave 5 ahead. It's to fearfull that the potential target for this wave is located between $9k and $10k. There I plan to invest in Bitcoin and some fundamental altcoins. I suppose most of altcoins will disappear at such low price levels. Anyway we have the clear scenario invalidation level. If Bitcoin will break through the $32800 - wave 1 bottom level, my Elliott wave formation is gonna be failed.
In updates I am going to add this idea with local scenarios which supports this scenario.

Eur/usd breakout trade weekly analysis hello traders eurusd the commercials has increased there sell position you can refer the cot data they are actually in a sell program but they been buying that means hedging we might see a sell coming to the market and seasonally in the month of may eurusd like to sell .lets see how it play out .

BTC: 2021 on repeat! 13.5k can happen!Here's a quick comparison of two periods in bitcoins history
The current market period appears to unfold similarly to the one observed in 2021. If this trend continues, the market will likely experience a downward movement, potentially leading to a decline in value to 13.5k.
While it's true that history doesn't necessarily have to repeat itself, it is often observed that historical patterns tend to rhyme with the present.
Moreover, the price of Bitcoin was recently rejected from the bear market downtrend resistance, indicating a potential move to the previous bottom of $15.5k, which is consistent with the concept of the price following a pattern reminiscent of the 2021 summer period. It's also worth mentioning that the S&P 500 has been showing some weakness, and since BTC typically moves in lockstep with the S&P 500, it can be prudent to monitor its movement.
The bear market probability index is currently at an all-time high, which suggests that the ongoing rally could be considered the biggest bull trap ever witnessed in the history of Bitcoin. While relying on a solitary model is insufficient for drawing definitive conclusions, numerous indicators suggest a downward price trend in this case.
The US interest rate has reached the same level as it was during the onset of the 2008 Financial Crisis market decline. This should be taken into consideration. Despite this, on Twitter, someone claims almost every other day that BTC will reach 100k soon. However, in my opinion, this is complete nonsense. Given the current state of the financial market, it's not ready for a sustained uptrend.
Lastly, the market is experiencing a notable increase in fear, likely due to multiple factors simultaneously impacting the market. Based on historical precedent, it is reasonable to anticipate significant downward market movements should prior trends repeat themselves.
With regards to Altcoins
t appears that the overall market is experiencing a weakening trend. Suppose BTC continues to decline from its current position; the Altcoin market cap is expected to break below its recent uptrend. This could potentially lead to a significant drop in the altcoin market cap, down to around 300B. Given these circumstances, it may be wise for individuals to avoid investing in ALTCOINS for now and instead wait for more favorable market conditions to emerge.
Also, Current market conditions suggest that many altcoins are exhibiting a bearish outlook, with many having breached their BTC-pair support levels. This indicates that in the event of another drop in BTC prices, altcoins will likely suffer significant losses. I project that a 50-70% decline in altcoins may occur before August. I maintain a highly bearish stance regarding the upcoming summer period, which seems to resemble the summer period of 2021.
I expect the bottom to be between 8k and 12k!

BTC: 2021 on repeat! 13.5k can happen!Here's a quick comparison of two periods in bitcoins history
It appears that the current market period is unfolding similarly to the one observed in 2021. If this trend continues, it is likely that the market will experience a downward movement, potentially leading to a decline in value to 13.5k.
While it's true that history doesn't necessarily have to repeat itself, it is often observed that historical patterns tend to rhyme with the present.
Trade safe!!
-------------------------------------------
About our trades:
Our success rate is notably high, with 10 out of 11 posted trade setups achieving at least their first target upon a breakout price breach (The most on TW!) . Our TradingView page serves as a testament to this claim, and we invite you to verify it!
-------------------------------------------
Recent Altcoin trades:
ARB / USDT: 30% profit!
ROSE / USDT: 5% profit!
-------------------------------------------
If you like the content, then make sure to comment and like the post :D
Follow me for daily profitable trading setups.
BTC dictates the market. If BTC falls, then Alts will drop as well. Trade safe!
