Decreaing Triangle Pattern \ SHORT Not a financial advice.
This triangle pattern offers traders a bearish signal, indicating that the price will continue to lower as the pattern completes itself. Again, two trendlines form the pattern, but in this case, the supporting bottom line is flat, while the top resistance line slopes downward
Bearmarket

18.2k incoming! Here's a quick look at the 8 hr . BTC chart. As we can see, the price broke below the rising channel and is currently on a mission to close the fair value gap at 18.2k! It has already closed the gap at 20k.
These gaps tend to get filled at some point! Also, the DXY is expected to rally from its current level - when the DXY goes up, the BTC price will go down!
I firmly believe the bottom will be close to the 10-12k area. We have yet to see the last capitulation, IMO, yet! Trade Safe!
-------------------------------------------
Key Dates to Watch in March:
10 Mar: US Non-farm Payrolls
10 Mar: Mt. Gox Distribution
14 Mar: CPI Data Release
15 Mar: PPI Data Release
21/22 Mar: FOMC Meeting
30 Mar: GDP Report
-------------------------------------------
What's a Fair Value Gap?:
A fair value gap is the difference between a financial instrument's theoretical value and market value, such as a derivative or security. It can indicate a misprizing opportunity for traders to profit by buying or selling at the misprized level. In other words, there is a gap in the price in which some open orders still need to be filled. The price will return to fill the orders.
-------------------------------------------
If you like the content, then make sure to comment and like the post :D
Follow me for daily profitable trading setups.
BTC dictates the market. If BTC falls, then Alts will drop as well. Trade safe!

BTC - Bearish trend continues!Here's a quick look at the 8 hr. BTC chart. As we can see, the price broke below the rising channel and is currently testing the bottom of the support zone! If DXY keeps rallying, the support is not going to hold!
There are some unfilled Fair value gaps between 20k and 18k. These gaps tend to get filled at some point! Also, the DXY is expected to rally from its current level - when the DXY goes up, the BTC price will go down!
I firmly believe the bottom will be close to the 10-12k area. We have yet to see the last capitulation, IMO, yet! Trade Safe!
-------------------------------------------
Key Dates to Watch in March:
10 Mar: US Non-farm Payrolls
10 Mar: Mt. Gox Distribution
14 Mar: CPI Data Release
15 Mar: PPI Data Release
21/22 Mar: FOMC Meeting
30 Mar: GDP Report
-------------------------------------------
What's a Fair Value Gap?:
A fair value gap is the difference between a financial instrument's theoretical value and market value, such as a derivative or security. It can indicate a misprizing opportunity for traders to profit by buying or selling at the misprized level. In other words, there is a gap in the price in which some open orders still need to be filled. The price will return to fill the orders.
-------------------------------------------
If you like the content, then make sure to comment and like the post :D
Follow me for daily profitable trading setups.
BTC dictates the market. If BTC falls, then Alts will drop as well. Trade safe!


Bearish Breakdown of Bitcoin As discussed in my prior chart, Bitcoin was on a bearish breakdown. Prior support fell quickly and now looking towards is next support level of 18,600 - 19,600. Should that level fail look for it's next level support near 16k level. I closed my shorts for a profit but will plan to re-open should we get a retest of the recent s/r flip level. AS seen below, indicators are showing negative momentum on the daily chart. The Monthly chart is also pointing with negative momentum.

Link continues prediction to acomplishAs we mentioned it these past few weeks, ChainLink is in a Bearish trend, still, we have to wait to
close Short and start Long x2 during this month.
The prediction is running so well so far.
Thank you guys!

ETH plan for March and support levelsMarch 14 = CPI
March 15 = PPI
March 22 = FOMC
March ?? = Shanghai unlock
The rally and top is in for this quarter.
If we look at previous resistance and support levels I think we go to previous lows.

$DXY overtakes $BTCOne of the most important barometers for global currencies is the Dollar Index (DXY), which measures the value of the US Dollar versus a basket of global currencies.
What is the relationship between DXY and BTC?
What Does it Signify? It is a known fact that the crypto price movements are deeply correlated with the DXY Index since its inception. While the DXY index gets stranger, Bitcoin, Ethereum, and many other assets tend to fall. Besides, if the cryptos manifest their strength, then the dollar's strength tends to fall.

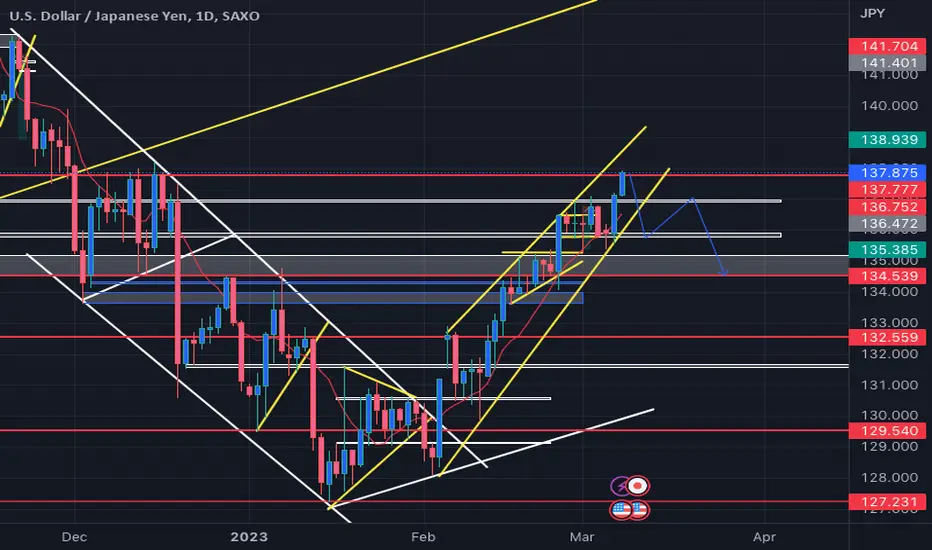
USDJPY, Bears IncomingHello all, this will be my first ever publication of my trading analysis. UJ has been on a corrective bullish market for some time now. I am confident that the bears are now going to take control of the market and continue the bearish momentum. Here in this photo, I have what swing I believe will occur to begin the paper trail. I will be waiting for a breakout of my bullish trend line to get my first confirmation of this down trend. FX:USDJPY
Bearish on Nasdaq100 with upp to 47 % return on 20xTrade Plan:
Asset: Nasdaq 100 index
Position: Short sell
Entry Point: 12360
Stop Loss: As this is a short position, the stop loss should be above the entry point to limit the potential loss. Based on your risk tolerance and the volatility of the market, you can set the stop loss at a level that you're comfortable with. Let's say you set the stop loss at 12600, which is 2% above the entry point.
Leverage: 20x
Position Size: The position size will depend on your capital and risk management strategy. As a general rule of thumb, you should risk no more than 1-2% of your account balance on a single trade. For example, if your account balance is $10,000, you can risk up to $200 on this trade. With 20x leverage, you can open a position worth $4,000 ($200 * 20).
Targets: Your first target is at 12255, which corresponds to the level of previous support. Your second target is at Fibonacci retracement level 0.382, which corresponds to a price level of 12216. Your third target is at Fibonacci retracement level 0.5, which corresponds to a price level of 12110. Your final target is at Fibonacci retracement level 0.618, which corresponds to a price level of 11999.
Exit Strategy: Once the price hits each target, you can take some profits off the table and adjust your stop loss to breakeven or slightly below it. For example, if the price hits the first target at 12255, you can sell half of your position and adjust your stop loss to 12480 (entry point) for the remaining half. If the price hits the second target at 12216, you can sell another quarter of your position and adjust your stop loss to 12500 for the remaining quarter. Similarly, if the price hits the third target at 12110, you can sell the remaining quarter of your position and adjust your stop loss to 12300 for a potential continuation trade.
Note: This is just an example trade plan based on the information you provided, and it's not a financial advice. Please do your own research and analysis before making any investment decisions. Always use appropriate risk management strategies, including stop losses, to protect your capital.

BTC outlookHere's a quick look at the 8 hr . BTC chart. As we can see, the price has been bouncing within a bigger broadening wedge and is currently retesting the bottom trendline. We should expect much lower prices if the price breaks below the trendline and support zone.
There are some unfilled Fair value gaps between 20k and 18k. These gaps tend to get filled at some point! Also, the DXY is expected to rally from its current level - when the DXY goes up, the BTC price will go down!
I firmly believe the bottom will be close to the 10-12k area. We have yet to see the last capitulation, IMO, yet! Trade Safe!
-------------------------------------------
Key Dates to Watch in March 🗓️
10 Mar: US Non-farm Payrolls
10 Mar: Mt. Gox Distribution
14 Mar: #CPI Data Release
15 Mar: #PPI Data Release
21/22 Mar: #FOMC Meeting
30 Mar: GDP Report
-------------------------------------------
What's a Fair Value Gap?:
A fair value gap is the difference between a financial instrument's theoretical value and market value, such as a derivative or security. It can indicate a misprizing opportunity for traders to profit by buying or selling at the misprized level. In other words, there is a gap in the price in which some open orders still need to be filled. The price will return to fill the orders.
-------------------------------------------
If you like the content, then make sure to comment and like the post :D
Follow me for daily profitable trading setups.
BTC dictates the market. If BTC falls, then Alts will drop as well. Trade safe!

Bear Will Growl AgainIt ain't over folks. I see so much hopium and happy nonsense every day here. It ain't getting any higher. Stop smoking weed and sit up straight!
Fact: No bear has ever ended with VIX <40. Ain't been north of 36 yet.
Fact: Y2K bubble ended on a 900+ day bear. This one looks a lot like it, and is not half done yet, only 420+ days into it.
Fact: Inflation remains unchecked after hiking rates nine times.
Fact: PEs are lower and outlook has been cloudy at best. SPX at 4K PE is 21+ >> historic mean 16; median 15; stonks is overvalued and ERs point to contracting not growing. Real simple math: 21-16 = 5/15 => 30% discount coming. 4K*(-0.30) = (-1.2k) SPX is going to 3K, target 2800-3200.
Fact: We are in QT NOT QE. Cost of making things, doing things, living is HIGHER and not going lower. Everything else is foolish hopium.
Hopium: Tesla is going back to the Moon!! The silly euphoria returning to tech darlings is another warning sign.
LOL Look at the retracements. Market stands at 50% retrace, and Tesla has got back to 50% of $400. Ripe for a short IMO.
All is ready for the final massive dump into the crapper. If you don't 'feel comfy' selling short then GTFO and get in cash. GLTA, ur gonna need it.

XAUUSD - Short Term Bullish Momentum XAUUSD is currently showing signs of a short term bullish momentum. After showing a break of structure and reversing to the downside it looks like XAUUSD has met a nice level of support where it may continue showing bullish movement until it reaches around the 1900-1925 level where we should see a strong resistance.
After reaching the 1900-1925 level we should see a strong bearish movement. To further this bearish sentiment this level would also be the second wave of the Elliott Wave Theory which would be followed by the 3rd wave. The 3rd wave is usually regarded as the most volatile and impulsive wave of the EWT which would be a great place to enter.
The next form of support that can be seen after should be around the 1777.500 area.
Upgrade your trading with me
For FREE SIGNALS and if you would like to see updates on this idea and many more please follow:
@wrightwayinvestments
@wrightwayinvestments
@wrightwayinvestments
✅ Hit the like button, and share for more!

US30 Dow Jones ShortDear friends and new viewers,
So far it seems that the Dow Jones is experiencing some resistance on its current price pullback. IF we break through the 50-day MVA and break through this key level of resistance we could see a return in an upward trend.
Even though it may seem tempting to enter a long here I would recommend a short instead since I am still bearish on the overall market. This could end up being a bull trap and could lead to a bearish outcome.
With the REX not showing a buy signal and since we are below the 50-day MVA as well as Jerome Powell still hiking interest rates, I believe this will be a bearish outcome.
Trade with caution,
~MC
www.forbes.com (FED rate hike for March, the meeting occurred and rates did get hiked.)

My Bearish Elliot BTC SCENARIO This is not an investment advice these are only my opinions. And my elliot count. I dnt think that bullish season started yet so I do not expect 18k now firt 27 28 k and then 12 13 k

#BTCUSDTMy hart says price will directly hit the 21700 price, and my brain also says the price need to do a correction movement to hit the upper side blue lines which placed on 23343 maximum upper line...price is doing a death cross on 4H chart and 21700 OB and 20750 Ob the last hope for bulls...unless we can see the price will kiss 12,000 level as soon as possible....in short term it will going to touch the upper key level of the falling wedge....all things can be happened or not.....

About to break down - Early callPrice has formed a bearish flag. Is not confirmed yet but it could open with a gap down at any day and I don't want to jump in too late. I just opened short position and I'll wait.

Macro and crypto: What should traders and investors expect?Hello, everyone! Today we would like to discuss macro and crypto, what affects that, what depends on that and what to expect from the market and when the new bull cycle will start
A LITTLE BIT OF THEORY
1. US PMI (Purchasing Managers Index) – macroeconomic indicator that shows the level of business activity.
2. DGS 1&5 – average 1 and 5 year US Treasury yield.
3. FED Funds Rate – the interest rate at which U.S. banks lend their excess reserves for short terms to other banks.
Let’s figure out what's GOOD and what's BAD for the crypto market
1. PMI
Values above 50 are a good sign, the economy is growing, markets have more liquidity.
Values below 50 are a bad sign, the economy is shrinking, there is less and less liquidity in the market.
2. DGS 1/5
High rates are bad, people are used to investing where there is a clear yield and clear rules for receiving returns, where there is less risk.
Low rates are good, bonds do not bring profitability, people are forced to choose more profitable, and therefore risky instruments for the preservation and multiplication of capital
3. FED Funds Rate
High rates are bad, the interest on capital and liquidity is becoming more and more, the required level of profitability must be higher than the prime rate + the rate of the individual counterparty. Liquidity becomes less and less, access to it becomes more and more difficult.
Low rates are good, liquidity is available to everyone, everyone can take funds to realize their goals and objectives, the overall profitability of any business is quite low. Lots of free money in the market.
Which market can be called BULLISH?
1. US PMI values above 50
2. Low DGS values 1/5
3. Low FED Funds Rate
That's the kind of market we had from April 2020 until November-December 2021. At that point, many realized that the music was no longer playing. The FED hammered the last nail in the coffin of the bull market in February-March 2022, and that's when all the fun and the official bear cycle began.
How do we know if the market has flipped and we're growing up again? Recommendations for PATIENT TRADERS
1. US PMI will come out of the crisis – current values are ATL from May 2020
2. The FED will do a soft landing, beat inflation and start lowering rates – very bullish signal. The important thing is to beat inflation, otherwise our bull market will be very short-lived, or the next bear market will be super painful.
3. DGS 1/5 will fall to spring 2020 values
If you see all of this, then unpack your stackable piggy bank and get ready for a hot period, we will be back in the game and the market of universal profits. As practice shows, everyone will have 3 to 6 months to get into their positions and get ready to take off. Also, remember that the market can be irrational, the main thing for everyone is to let their strategy survive it. Markets are capable of being irrational longer than traders will be solvent.
What to do now?
We’ve tried to give an answer to the question in our previous article. And we still stick to this local position. This article will allow you to look at the crypto market within macro analysis and the overall picture. But then everything depends on you!
Tell us if you study the macroeconomics rates, which indicators you use and which topics you would like to discuss! Don't forget to check links below and check our trading terminal!
NFA & DYOR

Broke the flag - Update of previous tradePrice just broke the bearish flag, we may see a retest that would be an opportunity to add to my short position.

Tesla again. Update of a previous tradeCheck my previous post below. Price has formed a HS in the daily timeframe. The chart shows how to playout this trade. It's just a suggestion and there are many other ways to do it. I'll be posting any changes.


AUD/USD 4H still bearish.As we analyze recently. We might see a bullish change of character in the 1H time-frame. But when we spike into 4H, we still see a clear bearish continuation trend. If the Dollar continues to be stronger these days than the AUD volume. We will see this continuation of bearish trend into AUD/USD. We use Fibonacci Retracement to see where our zone of pull-back would most likely be. We have a clear FVG on the 4H chart. By our analysis, we speculate that the price will bounce from the FVG level (Which is into the Fib premium zone as-well) and continue to the swing bullish order block. That's where we might exit. Will update further.

SOL PERSONAL ANALYSIS IN THE LONG TERM (UPDATED) HELLFIRE!What is up guys? I have been off for a decent while since I have been very busy with life however I am back. Please be reminded that a high probable trade is among us with SOLANA and other assets which will begin to go down this day up to a maximum of 19.6$ with an expected pullback up to 22.2$. As you can see in the chart, the Relative Strength Index has clearly given an image of consistent long-term (daily chart btw) losses of buyer interest which could only mean one thing -- an impending doom of a massive sell.
How does the Relative Strength Index help confirm the foreseen downtrend? It is mainly a tool that shows the strength of a particular movement whether if it may be bearish or bullish. In this scenario, the RSI shows that each pump is considerably weaker in momentum than the previous one and the price action demonstrates no further upside action and is now entering a slow-downtrend or a consolidation period. Buyers are uncertain if they can keep up with the positive sentiment and bears are now preparing their moneybags.
If you have any more questions, please feel free to chat, comment, react and share!
---------------------------------
