We could go as low as 7.4k! Bulls absolutely need to defend We have little to no support below these levels, we just pumped through them without spending much time, considering the traditional markets will probably be in a turmoil for about a year or so, expect bitcoin to drop as low as 8k! I do see a falling wedge, but we broke through too many support levels, we need a bounce now or it is over! Greetings from Dia
Bearmarket

SPX Daily TA BearishSPX/USD Daily bearish. *Inflation produced a higher high (.60% increase in CPI growth from April-May compared to March-April) at .83% FFR which essentially means that the Fed will probably consider ramping up rate increases by more than 50bp (75bp likely) in their meeting next week (06/14-06/15) to stay true to their "do whatever it takes to ring in inflation" promise. This is bearish for equities and cryptos as we will likely start to see more significant layoffs in corporations and less liquidity in capital markets.* Recommended ratio: 5% SPX, 95% Cash. Price is currently forming a Bearish Engulfing pattern as it trends down at 3900; it is still technically retesting $3938 minor support after breaking down below the lower trendline of the descending channel from August 2021 at $3981. Volume remains Moderate (high) and has favored sellers for three consecutive sessions (and seven of the last ten sessions). Parabolic SAR flips bullish at $4175 resistance, this margin is neutral at the moment. RSI is currently trending down and retesting 38.06 support; if it breaks below this level then it will likely retest both the uptrend line from August 2015 and the uptrend line from 01/26/22 at ~31. Stochastic remains bearish and is currently trending down at 40, the next support is at 18.32. MACD remains bullish and is currently on the verge of a bearish crossover as it trends down at -32; it would complete the crossover if it falls below -34. ADX formed a trough at 17 and is currently trending up at 19 as Price breaks down, this is mildly bearish. If Price is able to defend $3938 minor support then it will have to recapture the lower trendline of the descending channel from August 2020 at $3981 if it is to resist a steeper downfall. However, if Price continues to break down here, it will likely retest $3706.52 minor support for the first time since January 2021. Mental Stop Loss: (two consecutive closes above) $3981.

Super Rare chart on the False Top theorySo this is just for fun, but even our "just for fun" charts usually turn out to be partial truths. Sometimes they are eerily accurate. According to the past cycles where we got our "real top" and then double peaked with the "false top" that many analysts believe was due to market/geopolitical and inflation conditions- we should see something similar to this for the next cycle. I call this the "Banana Arc" graph. Nobody else in the crypto analysis space has anything close to this and it is purely speculative. I am sure as BTC starts to move with these arcs you will start seeing more people using it, but for now you got it here first. ENJOY!!!

ETH/USD Daily TA Cautiously BearishETH/USD Daily cautiously bearish. *CPI report came out today... 8.6% inflation reading sent both equity and crypto markets lower, Gold is slightly up on the day.* Recommended ratio: 20% ETH, 80% Cash. Price is currently breaking down below $1711 minor support (still technically retesting it) and looks like it wants to test the lower trendline of the descending channel from 05/11/22 at $1575. Volume remains Moderate (high) and is on track to favor sellers for four consecutive sessions if it can close today in the red. Parabolic SAR flips bullish at $1941 resistance. RSI is currently trending down at 34 and is still technically testing 36.91 support; the next support is the uptrend line from 01/22/22 at 27. Stochastic is on day two of being bearish and is currently retesting 46.76 support. MACD remains bullish but has formed a soft peak and is currently trending down slightly at -125; it would have to break below -140 to cross over bearish. ADX is currently forming a trough and is trending up slightly at 38 as Price continues to fall, this is bearish. If Price is able to bounce from $1711 minor support then it will likely retest the upper trendline of the descending channel at $1815 as resistance. However, if Price continue to break down here, it will likely retest the lower trendline of the descending channel at $1575 before potentially testing $1426 support (which would also coincide with the lower trendline of the descending channel from October 2021). Mental Stop Loss: (two consecutive closes above) $1812.

BTC LOGARTHIMIC CHARTbtc all data in 1 chart. maade this to support my claim to btc's journey to 20-12k, this chart clearly says if we only bottom to 20 k then it will take 720+ days to bottom but if we bottom at 12k it will take around 175 days to completely bottom down but if we experience a capitulation candle btc goes down to 9.3k. to understand this chart better i request youu to go through myy othyerr last 2 btc's chart

BTC LOGARITHIMIC CHART EXT./RETRACEMENTExtension/Part 2 of my BTC's Logarithmic Chart. Looking at past retracement pattern we see btc retraces 30-40% after every bull market, so if we follow that btc's bottom will be 20k or more, but for that we might need a push back upwards, above the 70k range, around 80k which can be possible if we get a reversal from this current consolidating range, but keeping the macro economic conditions in place a 50% or more retracement is quite possible


s&P ELLIOT WAVE FORCAST HEllo guys
this forcast bulid depened on Elliot way in forcasting the marketing
let's dive in
============================================
the big cycle is i
we start the first wave from 2$ until it hit 33$ and them we had a nice ocrrection to 5$ it end on 1933 may
we start the big biggest impulsive wave 3 it had a pretty nice move to the up and nice correction every
we got 5 waves inside wave 3 now we see the 5 waves end so excpect a down move and big correction on s&P all the way down i d k where we could stop but the idea is this doing lower we finished nice 5 samll waves inside the cycle ( ii ) - ( iii ) now we in correction wave ( IV )
==================================================================
RSI IS BEARISH ON THE monthly that a nice reason to dump this down as we see in the chart every time we havea davergence it's just a time until we see a nice down more correction and this small correction was for the small waves inside the big cycle
now we finished them all we enterting the big cycle IV correction .
==================================================================
from the start off the wave ii to iii s&P have so big divergence u can check it in the chart

StoneCo (STNE) following exactly: Wall street Cheat sheet Hello Traders / Investors
Seems like Wall st. Cheat sheet is CORRECT. Sad for me I realized it too late and missed some profits in last weeks.
Considering my DXY Elliot Wave coun, my expectation is another drop of STNE price where wave C will be 1.618 of A = Price around 5.5 USD. (Best place to buy some shares + Also watch Konvergence of RSI on 1D/1W TF).
ritholtz.com
Learning every day.
Trade safe, take care and enjoy the ride.

ETH LOGARTHIMIC CHART eth all data in 1 chart. made this too see where we are gonna bottom this bear season. this along with other eth charts supports the bottom to be around 320-305, though if we see a capitulation candle we see bttc around 9.3 and eth around 225-150. please take a look on other charts before seeing this

eth short ideaig everything is quite provided in the chart , but i really think it will go to lower limits since bt6c is going to 11.9. if eth bleeds every alt will.

btc daily btc made double top in monthly and 2 head and shoulders in daily, followed by a bullish channel after 1st and before 2nd. How am i so sure regarding the double top in monthly? because of 2 retest in daily which is at a perfect angle to the double top. btc will make corrections at 34400 level to before going to 19.4, which might be followed by a short term relief rally but will ultimately end up to 11900 level. 98% of retailers will be out by then and big institions like always fill their bags up which will end up btc to 52k . it will get rejected from that level again and will go to 29k level . it will grab so much liquidity again that the retailers will fomo once again and btc will end up in 72k - 78k range.

BTC/USD Daily TA Cautiously BullishBTC/USD Daily cautiously bullish. *BTC has been consolidating around $30k for thirty consecutive sessions now.* Recommended ratio: 70% BTC, 30% Cash. Price is currently attempting to close above $30507 for a second consecutive session after defending support at the 50/50 uptrend line from March 2017 ($29.5k). Volume remains Moderate (high) and is on track to favor buyers for a fourth consecutive session if it can close today in the green. RSI is currently testing the descending trendline from January 2021 at 52 after defending support at the uptrend line from January 2022 at 45; the next resistance is the uptrend line from November 2018. Stochastic remains bullish and is currently trending up at 87 as it is still technically testing 77.95 resistance; the next resistance is max top at 102.07. MACD remains bullish and is currently trending up at -542, the next resistance is at 312.67. ADX is currently trending down at 28 as Price continues pushing higher; this is mildly bullish and would become bullish if ADX formed a trough as Price continued to appreciate. If Price is able to break above the 30-day high at 32696 minor resistance, the next likely target is a retest of the 50 MA at $33347 (before potentially heading higher). However, if Price breaks back down below $30507 support then it will likely retest the 50/50 uptrend line from March 2017 at $29.5k before potentially falling lower ($24180 minor support). Mental Stop Loss: (one close below) $29273.

After a 94% fall, what's next?Gala is one of the – promised – cryptos that affected most in this bear market, considering that fell 94% since November 2021.
What’s next?
There are two main short-term S/R levels to watch.
If $0.07 support breaks, that will be … a disaster as it’s expected a (29 – 38) % drop.
On the other hand, if $0.095 breaks we may see a 55% surge max.
And that’s an optimistic scenario.

Peculiar Position for the MarketThe market is making an attempt to rally, but we will need to violate this repeating pattern if we can expect any upside from here. Otherwise, it's just another good entry for short positions. Why buy an overpriced market if holding cash would yield positive with no risk of entry or exit?
Here are some sentiment metrics and things to keep in mind, some technical and some fundamental. There's more of them but here are the ones I can immediately think of:
DXY is still rallying.
The US dollar historically loses 5% purchasing power per year, yet is seen as a safe haven. This is how overpriced the market is.
Japan, the largest purchaser of USA treasuries, is now a net seller.
Foreign bank exposure of US Treasuries is now declining as opposed to rising as in 2008.
USA cannot fund a central bank bailout via foreign purchases of treasuries as in 2008.
Some commodities are still at multi-decade lows, save for EV related markets and others which were forcefully subsidized.
Oil is rallying with a distinct lack of supply increase AND increased seasonal demand.
Because fuels are rallying, transportation costs are increasing baseline costs for every person and business.
Fertilizers and other chemicals are in short supply which increases food prices.
Some top producing food countries are now restricting imports.
The rate of home purchases is declining rapidly, mortgage rates and risky variable interest rate mortgage deals are rising.
Most of the rally in the past week was in profitless tech.
Increased USA consumer spending is solely based on increasing consumer credit card debt, rather than savings or income.
Central bank interest rates are not anywhere near the price inflation rates and are causing malinvestment to linger.
The rate of layoffs is increasing and has not met or exceeded 2020 levels.
Layoffs in the past few months were mostly in small businesses with most medium and larger ones adding employees, yet suddenly almost all of them have stopped hiring.
There is a lack of specialized skilled labor and this demand is not being met with supply.
The largest stocks have not had a serious decline.
The percentage of stocks in a downtrend has not yet met the lows of 2016, 2018, or 2020.
Cryptos have not yet dropped to their 200D MA and consolidated sideways as was the case in 2016 and 2018.
Some, but not all cryptos have just made a 30-100% rally and are selling off in a hint of downward continuation.
(VIX + VXN) has not yet met or exceeded the peaks of 2001, 2008, 2011, 2012, 2015, 2018, or 2020.
Chinese housing stocks still in a downtrend, -70% yoy, companies are failing to pay interest. This housing market is valued higher than the US stock market.
The war in Ukraine clearly is not short-term and is a catalyst for future proxy wars, central bank robbery of citizens, and wealth destruction.
Fake CPI data comes out on friday.
---------------------------------------
Unless some of these things have a serious turnaround in the next 3-12 months, the market will not turn fundamentally bullish. Sure, we might get a suckers' rally, but until we get a huge bailout or many of these conditions improve, there is absolutely no reason to lean heavily towards risk-on and everyone MUST do their fiduciary duty of capital preservation. With that said, there is opportunity all around if you look hard enough.
Do not use your capital to price yourself into a mispriced market.
Let me know what you think!
Thanks for taking a look and don't forget to hedge your bets!

ETH/USD Daily TA Neutral BullishETH/USD Daily neutral with a bullish bias. *The Merge is scheduled to go live on Ropsten Testnet in the next couple of days. Price is on day 26 of trading within a Bull Flag. Bitcoin has broken out to the upside. Still unclear whether this is a retracement or reversal.* Recommended ratio: 55% ETH, 45% Cash. Price is currently retesting the upper trendline of the Bull Flag from 05/12/22 after briefly retesting $1941 resistance. Volume remains Moderate (low) and is on track to favor buyers for three consecutive sessions if it can close today in the green. Parabolic SAR flips bullish at $1979, this margin is bullish. RSI is currently trending up at 42.71 after bouncing from 36.91 support. Stochastic crossed over bullish in today's session and is currently trending up at 71, the next resistance is at 80.69. MACD remains bullish and is currently trending up slightly at -135, the next resistance is at -90.80. ADX is currently trending down at 40 as Price continues consolidating, if ADX can form a trough as Price continues up it would be bullish. If Price is able break out above $1941, it will likely retest the 50/50 uptrend line from February 2017 at $2140. However, if Price breaks down here then it will likely retest $1711 minor support before potentially falling lower (lower trendline of the Bull Flag at $1600). Mental Stop Loss: (one close below) $1711.

Bull trap on BTC!!!In this video i am explaining where i think we are going to go from here and also i'm looking at the 4 hourly, daily, weekly and monthly chart.
This is my first video and i hope you'll like it. Also i'm sorry for my speaking mistakes, I'm trying to improve my english.
What do you think about my first video and analysis ?
Feel free to leave a comment.
If you like my ideas please follow me and like because you can always find something interesting on my profile, i am new to Treadingview but i have 6 years expirience in trading.
DON'T SELL YOUR CRYPTO
BTC TO THE MOON!!!

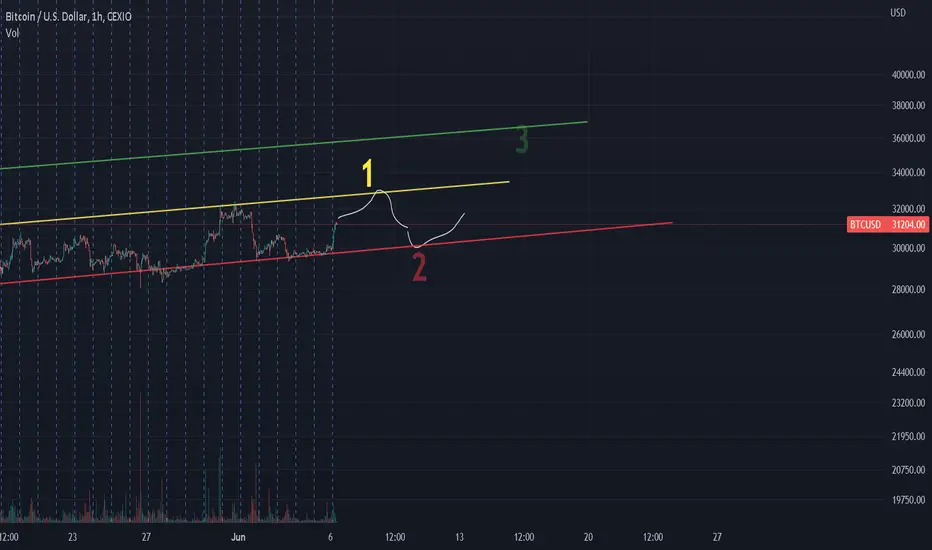
Local corection in June (3)Another option is how a correction can take place if sales are stronger towards the support line.
Bounces on the news or on glimpses of unjustified optimism.

Local correction in June (2)Same thing but from a slightly different angle.
No matter how you look at it, a rebound is quite likely.
So far, I do not expect a collapse on such fear.
BTC/USD Daily Neutral BullishBTC/USD Daily neutral with a bullish bias. *SELL OFF WATCH. Price has been testing $30k for twenty eight consecutive sessions now*. Recommended ratio: 51% BTC, 49% Cash. Price is currently back to trading in the second largest supply/demand zone just below $30507 resistance and is also testing the 50/50 uptrend line from March 2017 as support at $29.5k for a twenty fourth consecutive session. Volume remains Moderate (low) and has been shrinking for five consecutive sessions now (which implies that a breakout or breakdown is pending); it is currently on track to favor buyers three out of the past four sessions if it is able to close today in the green. Parabolic SAR flips bearish at $28.5k, this margin is mildly bearish. RSI is currently testing the uptrend line from 01/22/22 at 45 as resistance after bouncing from 42.41 support. Stochastic continues to test 55.55 support for a third consecutive session and is currently on the verge of a bullish crossover. MACD remains bullish and is currently trending up slightly at -920; the next resistance is at 312.67 and the next support at -1435. ADX is currently trending down slightly and beginning to form a trough at 32 as Price continues to consolidate at $30k; this is mildly bullish. If Price is able to break out (and close) above $30507, the next likely target is a test of the 50 MA at ~$34k as resistance. However, if Price breaks down here then it will likely fall fairly quickly to $24180 minor support before potentially falling lower to $20k. Mental Stop Loss: (tight stop - one close below) $29k.

Accumulation Zone!$BTC is more than 50% off from its ATH. Time to accumulate and keep stacking and stacking and ignore all the FUD and negativity surrounding Bitcoin. I set 3 target levels i believe we will reach within several months. This bear market is an opportunity to capitalize on people's miscalculations due to their fomo. A continue short is inevitable. The bottom wont be here for another several months or so. Only the patient one wins.

ETH/USD Daily TA Neutral BearishETH/USD Daily neutral bearish. *BREAKOUT WATCH, ETH is on day 24 of trading within a Bull Flag.* Recommended ratio: 40% ETH, 60% Cash. Price is currently testing $1711 minor support as it is approaching twenty five consecutive sessions of trading within a Bull Flag (bottom of the Flag is currently at $1650). Volume remains Moderate (low) and has been fairly balanced between buyers and sellers recently (indicating consolidation). Parabolic SAR flips bullish at $2000, this margin is neutral at the moment. RSI is currently trending sideways at 36.91 support. Stochastic is currently forming a trough at 55 just above 46.76 support; a break above 59 would result in a bullish crossover. MACD remains bullish and is currently trending sideways at -158; a break below -180 would result in a bearish crossover. ADX is currently trending down slightly at 42 as Price is testing $1711 minor support, this is neutral at the moment. If Price is able to defend support (minor) at $1711, the next likely target is a retest of the upper trendline of the Bull Flag at ~$1900. However, if Price breaks down here, it will likely retest the lower trendline of the Bull Flag at $1650. Mental Stop Loss: (two consecutive closes above) $1941.

What is the lowest possible price for bitcoin?Ask yourself what is the lowest possible price for bitcoin?
20000? 15000? Theoretically, the price will be - 0.
I'm not saying that there will be such a price, but if there is a panic in the market, keep this in mind.
By the way, how much is Terra Luna now?
Keep in mind that bitcoin was worth exactly zero at first.
And the correction will probably drag closer to that number as well.
You may start to panic.
In May 2010, 10 thousand bitcoins were equal to $40-$50 (an American bought two pizzas for 10 thousand bitcoins).
That is, a person sold 10 thousand bitcoins and he actually just gave them away. It is clear that not all of his bitcoins.
Perhaps he had 100 thousand bitcoins and he did not feel sorry for selling them. That is, there are people who have a bunch of these bitcoins.
Many years have passed, but in fact nothing has changed globally, everything except the value of bitcoin.
I can't take and buy anything with bitcoin, there are just a bunch of people who want to sell it for more.
I took 2009 as a starting point and drew trend lines from zero.
At first, we don't have prices until we sold two pizzas for 10,000 bitcoins. Then the price started to rise sharply.
As you can see, each subsequent wave of the trend has less strength.
In fact, if you look at the real from afar, bitcoin has not yet hit the real bear market, where the next wave will cover the bottom of the previous one.
But as the trend fades, it can happen and the next wave could rewrite the 3000 low.
Perhaps this will not happen and bitcoin will hold the 3000 level or be higher than it, but look at the trend.
Looks like waves 1, 2, 3 are fixing now.
Now look at the volume in 2015 and 2020-2022. Someone is now quietly fixing and distributing bitcoins,
At the same time, there are no serous purchases and panic sales. Everything is still ahead!
