ETH/USD Daily Neutral BearishETH/USD Daily neutral with a bearish bias. *Fed is on day 2 of decreasing the balance sheet, Jamie Dimon says JPMorgan is bracing for an 'economic hurricane' , St. Louis Fed President Bullard suggests cuts may be possible in 2023 or 2024 once inflation comes down and there is widespread unanimity in both the Fed and Congress that inflation is the number one priority (hence the frontloading funds rate hikes this year). However, not all is bearish considering Ethereum has launched a new beacon chain on the Ropsten testnet and first trial of The Merge is expected on June 8th .* Recommended ratio: 40% ETH, 60% Cash. Price is currently trending down at $1850 after being rejected by the upper trendline of the Bull Flag from 05/12/22 at $1941 resistance; the next support is at $1711. Volume remains moderate and is currently on track to break break a two day streak of seller dominance if it can close today in the green. Parabolic SAR flips bullish at $2019; this margin is neutral at the moment. RSI is currently trending up slightly at 39.67 after bouncing from 36.91 support. Stochastic crossed over bearish in today's session and is currently trending down at 70 after being rejected by 80.69 resistance on the first test. MACD remains bullish and is currently trending up slightly at -160; the next resistance is at -90.80. ADX is currently trending down and beginning to form a trough at 43 as Price is falling; this is neutral at the moment. If Price is able to bounce here ($1850), it will likely retest the upper trendline of the Bull Flag at $1941 resistance. However, if Price continues to fall here then it will likely retest the lower trendline of the Bull Flag at $1711 minor support (and potentially lower). Mental Stop Loss: (two consecutive closes above) $1941.
Bearmarket

CRYPTO.COM +200% Crypto.com an exchange token has been following a specific fractal that has been seen in the 2018-2019 bear market for bitcoin.
This of course is purely speculation and shouldn't be taken seriously until we breakout of the descending channel, I do believe however that we are coming to an end for this years bear market and personally this is when I will be dollar cost averaging into coins that have big upside potential... CRO being one of them
Not financial advice DYOR.

BTC/USD Daily TA Neutral BullishBTC/USD Daily TA neutral with a bullish bias. *SELL-OFF WATCH* . *For the first time in history, the DOJ charged former OpenSea Head of Product Nate Chastain for Insider Trading with NFTs while he was at OpenSea. That headline surely didn't go over well with the crypto community.* Recommended ratio: 51% BTC, 49% Cash. Price is currently retesting the 50/50 uptrend line from March 2017 at $29691 as support and risks flipping the bias bearish if it closes below $30k in today's session. Volume remains moderate (low) and is currently on track to break the four day streak of buyer dominance if it can close today in the red. Parabolic SAR flips bearish at $27500, this margin is neutral at the moment. RSI is currently testing the uptrend line from 01/22/22 at 42.41 support after being rejected by the descending trendline from January 2021 at 52. Stochastic crossed over bearish in today's session and is currently trending down at 83 as it approaches a retest of 77.95 support. MACD remains bullish and is beginning to form a peak at -1135; it is still technically testing -1435 resistance. ADX is currently trending down at 36 and is beginning to form a trough as Price fell back down below $30k, this is mildly bearish. If Price is able to bounce from the 50/50 uptrend line from March 2017 (~$29.6k) then it will have to close above $30507 in order to continue a rally and potentially retest the 50 MA at ~$34.5k. However, if Price breaks down below the 50/50 uptrend line then it will likely test $24180 minor support before potentially falling lower. Mental Stop Loss: (tight stop - one close below) $29186.

AAPL/USD Daily TA Neutral BullishAAPL/USD Daily neutral with a bullish bias. *With China loosening their Covid-19 restrictions/lockdowns and planning QE (via a digital Yuan airdrop ) in the coming weeks, fears regarding supply chain constraints' potential negative effect on Apple product demand for their next market cycle is starting to subside. Additionally, Apple announced a new $90b share buyback program and a dividend increase of 7% . However, Big Tech is not out of the rubble yet so it's a bit premature to get too bullish at the moment.* Recommended ratio: 60% AAPL, 40% Cash. Price is currently testing $149.05 minor resistance (which is also the largest supply/demand zone on record) as the 50 MA is on the verge of crossing below the 200 MA (which would form a Death Cross); it should be noted that even though the 50 MA is so close to crossing over, it is a lagging indicator and therefore can reject the crossover at the very last second. Volume remains high (moderate) and is currently on track to break a three day streak of buyer dominance if it can close today in the red. Parabolic SAR flips bearish at $133; this margin is mildly bearish at the moment. RSI is currently trending down slightly at 48, just below 57.58 resistance; the next support is at 35.61. Stochastic remains bullish at 98 and is currently on the verge of testing max top. MACD remains bullish and is currently trending up at -4.36 after bouncing off of the ATL at -6.69; the next resistance is at -2.36. ADX is currently trending down at 23.71 as Price is surging, this indicates that either a temporary retracement or a trend reversal is underway and is thus mildly bullish. If Price is able to flip $149.05 minor resistance to support, then the next likely target is a test of $157.42 resistance. However, if Price breaks down here, it will likely increase the odds of a Death Cross significantly and have Price retest $138.46 support (which would coincide with the lower trendline of the channel from January 2019). Mental Stop Loss: (one close below) $146.82.

BTC/USD Daily TA Cautiously BullishBTC/USD Daily cautiously bullish. *Bear Market Rally is underway and $30k support appears to be the short-medium term bottom.* Recommended ratio: 75% BTC, 25% cash. Price is currently breaking out above $30507 resistance after bouncing from the 50/50 uptrend line from March 2017 at $29.5k; it was testing this uptrend line for twenty consecutive sessions. Volume remains moderate (low) and surged yesterday as Price broke out to the upside (invalidating a descending triangle). Parabolic SAR flips bearish at $27120, this margins is neutral at the moment. RSI is currently testing a critical resistance at the descending trendline from January 2021 (51) after reclaiming the uptrend line from January 2022 at 44 as support; if it can break above the descending trendline from January 2021, it will likely test the uptrend line from November 2018 as resistance at 54. Stochastic remains bullish and is currently trending up at 99.75 as it quickly approaches a test of max top (101). MACD remains bullish and is currently trending up at -1206; it is still technically testing -1435 resistance. ADX is currently trending down at 37 as Price is trending up, this indicates that a reversal or retracement is underway and is mildly bullish. If Price is able to continue surging, the next likely target is a test of the 50 MA at ~$35k. However, if this surge was actually a Dead Cat Bounce/Bull Trap then a retest of $30507 support and the uptrend line from March 2017 at $29.5k is likely (with potential to fall much lower). Mental Stop Loss: (one close below) $30k.

Where is the crash everybody keeps telling me about?... I don't see it! If there is going to be a crash we have a lot further to go. Don't you think?

Where will be the BTC Bottom?It's been roughly a bear market for a while now, and where will be the bottom is a hot topic these days. In my opinion, BTC has still room to drop until the real capitulation happens; therefore I can imagine a classic 80% Drop from its all-time high which is arguably in confluence with some powerful levels, including two long time frame Fib levels.
Of course, in the end, the market will surprise us all.

BTC - Signs of bottomBitcoin is forming its cyclical market bottom. A spike to a lower-low with a v-shape recovery is in the future, IF history is any indicator.
Looking at the 2015 market low (left) and the 2018 market low(centre) we can see clearly that the once price crosses above the 1D 12 MA AND 20 MA then the market low is in the past. In both instances that crossing was concurrent with increasing volume until price spiked above the upper-Bollinger Band. These are the milestone proof-points of the market bottom.
In the current market, those events are still in our future.
I feel a spike down to a new low is imminent, possibly forming a effective double bottom around the $25k level. History tells us we should then see a discernable upward trend in all indicators, with milestone proof-points confirmed in the following week.
What do you think, is price about to crash to sub $20k, take off to the moon, or emulate these past bear market lows?

Comparison of BTC bear markets (2015,2018,2022)There are 3 charts of the BTC/USD Index where you can see 200 days EMA - blue line (moving average exponential) and 365 days EMA - black line. In all three scenarios, we can see the crossover of both EMAs which means to be a very strong bearish signal.
In 2015 after the beginning of the second BTC bear market in DEC 2013, we got an 85% drop-down in the price and it lasted 403 days. After the bottom in JAN 2015, BTC tried to recover and it was showing a nice buying power but bears were fully controlling the market at that time and BTC declined again in AUG 2015 where was created a Double Bottom figure.
But most interesting for us is that after the crossover of 200 and 365 EMAs the price decreased by 53% in NOV-DEC 2014.
2018 was a third bear market which started in DEC 2017 with an 83-84% drop-down in the price and it lasted 362 days. In this cycle, we can see the same situation with the crossover as in the second bear market.
In the present time on the chart, we got exactly what was previously twice and it could lead to a new strong movement down to 13000 - 14000 price level.
May the profit be with you!

$ALB Short IdeaALB big gap up before ER has me suspect... also technically it looks like FEB price action is still in a downward channel, and now there is a juicy gap below :)
I like the R/R on a short before ER's move.
Small size, picked up a few puts. Can also do bear spreads for less risk exposure.

Will BTC crash to $10k-9k or retest that Rising Wedge?Monthly TF, BTC broke Rising Wedge, since then been going down.
Question is whether BTC gonna go back up for that retest or just crash down?
BTC was filled as a LV when it went from $9k-10k to $69k.
Rule of thumb: LV always get filled the same way it went either up or down.
But BTC $10k is incoming for sure and real as that LV need to be filled.
It's gonna be a crazy ride. Stay Tuned. Bear market is not over yet.

Tesla & Nordstrom OpportunitiesBear market is here and we are seeing swings up & down today. Nordstrom reporting earnings willthey go up or tank?


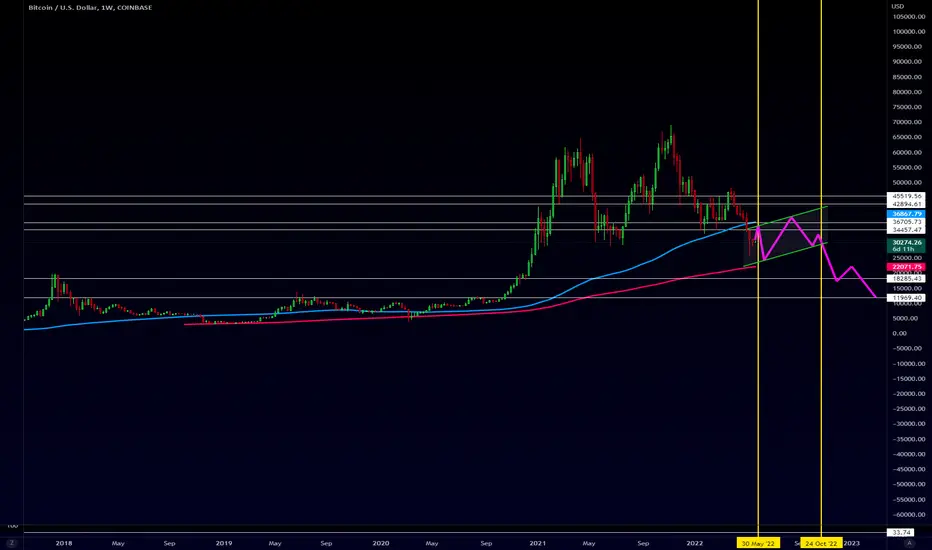
BTC New Bear Pattern IncomingBTC new trading range before capitulation. I'm expecting a dump with the new moon around May the 30th. Fake rally with a top at 40k or slightly below. Then downtrend continuation way below the weekly MA 200
BTC - another Dead Cat Bounce is Here.If you ask me, what will be the price action for Bitcoin in the coming months, here is the answer.
You can agree or disagree with the reasons only.
Not financial advice.

FTM Double TopFTM shows a clear double top (bear formation), like other top alts ( in a more shy way). Others show also double top but last peak higher is than the first one (like BTC), but we should imho play safe and considerer double top the same.
Due to the delicate macro situation, pre war cenario, inflation, tax rates, sp500 double top, btc domination rise, and so on, I believe 99% of all crypto will go more downwards than up, during a long period of time: 12-18months.
I may be wrong of course.
Good luck.

BTCUSDT potential fractalPotential fractal predicting with Fibonacci time frames based on Fisher Transform oscillator fractals. I'm expecting a retest to upper trendline @ 29.7k before the potential dump. It's require patience for 2D more. On Ehlers Stochastic CG we can see a bullish momentum to wait.

NASDAQ 100Look at the Correlation Matrix heatmap for stock-bond correlation.
See you at 10.700 level
Short every spike.

Bear market?Bear market? Yes, an increasingly similar 2022, even worse, to 2018. This is already what we are experiencing on the financial markets.
Hard times for long traders, for swing traders, while golden opportunities for day traders, for those who know how to take advantage of moments of volatility. Volatility that hasn't been seen in a while, especially on the S&P500.
As for me, having a very very strict risk management, for swing or day trading operations, I prefer to focus on the long-term portfolio, accumulating and rebalancing my ETF portfolio which is my real "safe haven" in difficult times.
It is during the downturn that stocks pass from the hands of traders to those of investors. One of the most truthful phrases I've ever heard since doing this job.
Returning to trading, the expectation for June 15-16 is felt by the market; uncertainty has never brought anything good, paradoxically a further .50 point hike from the FED but with falling inflation it would be welcomed by the market. The level of inflation is the most important thermometer, and it has reached such high levels that it bothered some analysts to remember the Volcker maneuver.
I don't think so and I hope it will go that far. What is certain is that the Fed has waited too long to raise rates and international tension and the consequent increase in commodities has aggravated the situation.
It is no coincidence that the oil trade and my commodity ETF are the two biggest gains this year as far as I'm concerned.
I close by summarizing my recent activities:
Purchase (accumulation) on Apple (AAPL) close May 19
MSCI World ETF purchase (accumulation) 19 May close
Buy (accumulate) emerging markets ETFs May 19th close
Happy trading
Lazy bull
DISCLAIMER: I am not a financial advisor. These posts, videos, and any other contents are for educational and entertainment purposes only. Investing of any kind involves risk. While it is possible to minimize risk, your investments are solely your responsibility. It is imperative that you conduct your own research. I am merely sharing my opinion with no guarantee of gains or losses on investments.

S&P 500 Bear MarketWe are Officially in a BEAR MARKET
A bear market is defined as a 20% drop from a major stock index's peak, and S&P 500 index is down 20 percent.
Now the question is , is there a recession coming?
Well, when you travel back in the chart to the Great Recession in 1929, you'll see how S&P 500 indice almost looks the same of what it is now, S&P 500 has risen by 500% over 8 years since 1921, followed by the great recession in 1929, S&P 500 fell down 85 percent, and now the same indice has risen up 620% since 2009.
Thinking objectively, this comparison looks scary, we have seen the bear market many times, but we haven't witnessed a significant drop like what happened in 1929.
Maybe it's just a regular bear market, Who Knows?!

$BJ $WHR Short Ideas still early in phase 4 downtrendFor the shorts, more trade ideas on stocks that are still early in phase 4 downtrend IMO.
BJ - see more downside, although would like a retest of breakdown for another opportunity however we may not get one, started short small size, looking for $48 zone to cover
WHR - Better setup IMO, broke down then retest and rejected. Looking for $154 zone to cover

$SPX $AAPL $TSLA $ITB Chart breakdownClosing the week red again. Bears seem to be in total control, charts breaking down across the board (less VIX/ Bear Funds of course)
SPX less than 3850 (-20%) funds go officially "Bear Market"
3700 Capitulation levels
Less than 3500 massive de leverage , margin-calls , and breakdown
We need one of those "bear market rallies" I keep hearing about ...
7 red weeks in a row, very historical price action, caught a lot of people off guard, including me : )

BTC - Playing out as per analysis.Fake-outs will be there, but ultimately it has to drop to the demand level. Be cautious in the current bear market.
Not financial advice.
