EURUSD Bearish Outlook Still IntactFundamental:
No high impact news release coming out in the next 20hrs for The Euro And The USD. Investors staying hopeful on the United States Dollar after Jerome Powell's speech last week at the Jackson Hole Symposium.
Further, increases interest rate for the euro might be bad for businesses at the moment due to inflation.... maybe
Technical:
Mild resistance around 1.0824 but should hold long as 15 mins 200 EMA should act as a strong support for buyers.
I'll be looking the resistance around 1.0852. The 1 hrs 200 EMA also stays as resistance at this point. The Dollar Index (DXY) should also rise and break above 104.44.
Bearmarket

BTC ---> 2 ScenariosI'm going to relate this post to my previous one. This idea gives actual technical price levels to watch out for. To sum up , the blue channel's current breakout implies a slow retest. It aligns with the inflation rate reading announcement on the 13th of September. Therefore:
I'm bullish until the date of the reading
I expect high altcoin volatility (price increases are more likely) due to the temporary stagnation of major cryptos
Red scenario seems more likely at the moment
Do comment your opinion!

$ES_F Long, possible dead cat bounce?The market has transitioned back into a more mean-rev phase so I dont expect bull rallies to survive for long. Also shorts are likely to be more profitable since trend following indi's have printed bearish. But use this long to capitalize on a dead cat bounce that could happen. Im not sure that it'll go up to close the gap at 4590.
Trades:
Trade 1
Long 4400, sl 4370, tp 4460, 4470 (close).
moderate conviction. im more confident of getting initial negative returns upon entry given the lack of bull divs and exhaustion from indis. but i do have a higher conviction of hitting the tp targets. ~4420 is another bull entry but expect wicks to 4400.
Trade 2
Short 4465, sl 4500, tp 4370, 4300, 4200
low conviction, has a high likelihood of getting stopped out. wouldn't recommend it unless there's a severe bear reaction with some volume, which you'd should market in. but place a tight sl.
Trade 3
short 4545, sl 4620, tp 4470, 4370.
moderate/high conviction, assuming the short term bear trend is intact. this trade expects negative returns once entered but covers the case of the gap being covered.

BITCOIN - NO BULL RUN TILL MARCH 2024This Bitcoin chart right here is a monthly timeframe chart. We all have been expecting this bear market to be over but it keeps deceiving us. Here is a clue on what to expect in the coming month.
Based on 2017 bear cycle that lasted for 27 months (821 days) as displayed on the chart, we see the current 2021 bear market following the same trend.
We have four phases here and the number of months each lasted for
The All Time High - All Time Low (12 Months)
The Bull Trap (6 Months)
Accumulation Phase (9 Months)
And finally the;
All Time Low to All Time High (13 Months)
Comparing the two bear market together, we have completed the first two phases and we are in the accumulation phase.
Therefore, we have till February 2024 to accumulate our favorite gems before a bull run will kickstart.
Not a financial advice🙅🏼♂️
Share your opinion in the comment section✍️
Please support this idea with a LIKE👍 if you find it useful🥳
Happy Trading💰🥳🤗

#BITCOIN's 3 Year Moving Average = FIRM CEILINGWE SHOULD HAVE BROKEN above this 3 year average by now
and been using it as support to provide a launchpad into next year's having.
INSTEAD it has firmly been capping prices during these last few months when historicallym it would have been penetrated by now.
Quite concerning for those who are still heavily in #Altcoins

Tesla Bearish Weekly Analysis Till 101.81www.tradingview.com
1. Daily Below 200 EMA Strong Bearish Signal
2. Below 211.36 Red Daily Close Confirmation
Levels
1. 200.55-191.88
2. 177.25
3. 148.42
4. 101.81 - 98.89

Full 2 month Review Of Yokub_Umedovich analysisSee Full video and enjoy how is real Trading analysis
BINANCE:BTCUSDT.P BINANCE:COMPUSDT.P BINANCE:KNCUSDT.P BINANCE:LTCUSD.P BINANCE:DOGEUSDT.P

Bitcoin Just Died: sub $15k incomingIf Bitcoin loses FWB:25K , the bear market will be renewed for another 430 days.
The last time bitcoin lost critical FWB:25K support, it took 270 days to get back above it. The last time bitcoin lost FWB:25K support was 430 days ago.
If FWB:25K does not hold, sub $15k is extremely likely and we may not get back above FWB:25K until November 2024.

Nasdaq bear market?After hitting all of our take profits we are looking for the next trade set up.
We broke the daily support that dates back to March and there isn't any current major support that we are close to. This along with the bearish divergence and rejection around the .886 retracement inclines me to think that we have now began a major leg down that could bring us back to 12-13 k.
However, for that to happen we need continuation patterns and much more data. I think the price will float around here and we'll be able to assess the market better in the next days/week, so that we can action another trade. Long or short.

USDT Dominance Showing Signs of Continued StrengthPerhaps one of the most underrated market indicators, USDT.D is showing classic signs of accumulation and remains in a well established uptrend dating back to 2018.
The ascending triangle pattern suggests another market move is on the horizon. If this plays out to the upside for USDT.D then crypto market participants can expect volatility in the markets favoring traders with short positions established. To give this pattern a little added strength, the MACD histogram also shows signs of hidden bullish divergence on the oscillator.
Of course, no one knows for certainty where this market (or any market) is heading in the near future, however, with indications like this one, witnessing a negative move downward in crypto prices would not come as a surprise.

Bearish Alt-Bat On The Monthly Entering Years Long Bear MarketGold could be due for a years long correction down to A level at $1052 as that is the target of this Bearish Alt-Bat given the circumstances i wont be looking for any bullish setups on gold in the long-mid term only bearish ones.
This probably isn't a good sign for extended commodities either, the only commodities i will look for signs of bullishness in are undervalued ones like copper.

Current Pull-Back: A Perspective Using NASDAQ 100 WeeklyCME_MINI:NQ1! has had the sharpest pullback in last couple of weeks. The Semiconductor Industry NASDAQ:SOXX has been the largest driver in this selloffs. In this Trend Analysis, I tried to draw a perspective as to how deep this pullback could be given Support and Resistance areas that stood the test of time in recent years. I used Weekly chart to gain a broader perspective of where the index will end up in coming months.
It is easy to establish that the TOP of the Current Rally (~16,100), i.e., the Resistance has been determined by the Start of the Recent Bear Market in 2022. Which technically started with the collapse of the Post Pandemic Rally in early January, 2022. This is the most important Control Level that the current market needs to break for a further rally in the future.
The Bear Market in 2022 was strictly bound by the Wedge Resistance as we can see. The same phenomenon can also be shown by simply drawing an Anchored VWAP from the All Time High. Throughout the course of the Bear Trend CME_MINI:NQ1! could not break above the AVWAP. After the market established a bottom between October and December of 2022, it finally broke above the Wedge in the last week of January, 2023. We can call this the beginning of the current Bull Market. NASDAQ eventually broke the AVWAP in the last week of March 2023 to further confirm the Bull Trend. The AVWAP has worked as a Support Level since then until the market boosted up in May.
Now coming back to the Current Pull-back, It is not hard to identify that there is a possible Support Area at the bottom of the range (~14,775) which the Current Bull Trend has established. If this Support Level is held then the projected size of the pullback from the top will be approximately 8.0 %. Current price action has confirmed a breach of the Short Term EMA cloud in the Weekly chart. In the Daily chart it came down below the 50 day Moving Average which indicates Short Term bearish tendency. If CME_MINI:NQ1! doesn't take support at the Range Bottom, then we could think of the Long Term EMA cloud as secondary Support Area. The next Support Area could be the AVWAP from ATH. For now, there is no reason to believe that there will be a lingering pull-back in the market going forward to start another Bear Market. Our best "hope" is that the market will take support and continue the Bull Trend in coming months.
Please note that historically, in Pre-election years, August and September had been the most bearish months. This write-up is solely based on Technical and Trend Analysis to figure out the best case scenario.
Thanks for Reading!

🔴 DOGE USDT 🔴NO LIQUDITY SWEAP NO ENTRY.
STRUCTURE IS CHANGING ANYTIME.
EVERY CANDLE HAS LIQUIDITY.
PRICE ALWAYS NEED LIQUIDITY.
Nobody Knows Where is Price Going.
Hey traders, here is the analysi.
If you guys like my analysis please hit like?? and follow.
Thanks.
SMART MONEY CONCEPT.
identify Liquidity Or Become Liquidity
DISCLAIMER- This is not financial advice.

SPY wanting to repeat history. BEAR MARKET TO RETURN 🐻AMEX:SPY approaches supply from 2022. We have a solid rejection candle and have closed last week below the supply zone. Reversal is imminent - supported by heavy absorption of buyers at the ask on the cumulative delta volume chart.

AUDUSD,Bearish trend,Head and ShoulderGood afternoon,
I hope everyone had a succesful trading week and week in their daily lives. Here is a pre market forecast for AUDUSD this upcoming trading week. Last week, AUDUSD was bearish for the most of last week. Toward the end of the week it began a retracement process. Price broke the daily supply/demand area @0.65944.
Price is projected to continue bearish momentum to the next 4hr supply/demand area @0.65464. If price rejects this area, look for the head and shoulder formation to form to confirm this projection.
If there are any questions, comments, concerns, or you may have a similar analysis to mine please do not hesitate to share, comment, and boost this post.

NIFTY INTRADAY LEVELS FOR 04/08/2023BUY ABOVE - 19420
SL - 19380
TARGETS - 19470,19520,19560
SELL BELOW - 19350
SL - 19380
TARGETS - 19300,19230,19160
Previous Day High - 19537
Previous Day Low - 19296
I am sharing NIFTY levels this levels acts as important support & resistance for intraday. if you want to trade with this levels wait for 15 min Candle closing above that levels. You can trade with breakout and reversal both.
Based on price action major support & resistance's are here, the red lines acts as resistances, the green lines acts as supports. If the price breaks the support/resistance, it will move to the next support/resistance line. White lines indicates previous day high & low, high acts as a resistance & low acts as a support for next day.
Please NOTE: this levels are for intraday trading only.
Disclaimer - All information on this page is for educational purposes only,
we are not SEBI Registered, Please consult a SEBI registered financial advisor for your financial matters before investing And taking any decision. We are not responsible for any profit/loss you made.
Request your support and engagement by liking and commenting & follow to provide encouragement
HAPPY TRADING 👍

SPX500 Bear Setup-EWClear wave structure here we have two paths to keep an eye on. Line in the sand is 4200, but could dip as low as 4000 and still resume bullish trend. Currently looking to tp around 4200 zone.

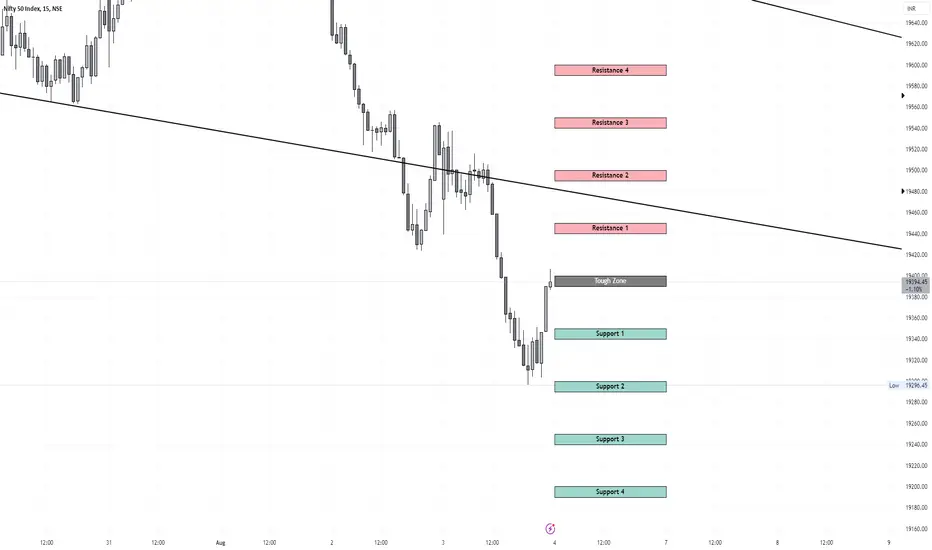
Nifty50 Levels for 04-08-2023#Nifty50 Levels for 04-08-2023
> If you're following these zones then kindly follow the rules too. Risk management, Position sizing, Confirmations.
> This is my perception of the market so, kindly do your analysis to get more clarity on the market.
> These levels might help you guys. As per my view, I'm sharing it with you guys.
> This is not a blueprint to happen so, kindly do your own analysis along with my view. Thank you for your SUPPORT.
#SPX is testing a key price level after 2 years#SPX is retesting the key price level , break of which started the #bear market. A fail here could lead to test of meaningful support levels below.

tata motors bearish divergence triggeredbetter not to invest in tata mototrs right now ..
can reach 530 .if slipped below 530 can reach 430 as beasish view

Banknifty Bearish Under 45450 till 45100Banknifty Bearish Under 45450 till 45100
Low Support Area
bearish till 45200 OI
after 11.30 Eruopean market open may be sideways market and after 1 may be trending

Nifty Below 19500 Bearish till 19000Fib Retracement 19600 till 50% Pullback to Go higher than 20k
Below 19500 M pattern activation till 19000
Above 21 EMA
50 EMA
100 EMA
200 EMA

Kncusdt.P Short Term Targets BINANCE:KNCUSD.P Technical Analysis,
Fib Retracement + Resistence zone
Short Term Targets : 0,65/ 0,60 / 0,55
If we can see Bitcoin can Broke all support zone we keep our knc Targets.
