Navigating Volatile Markets Navigating Volatile Markets: Strategies for Turbulent Times
Introduction
Financial markets are no stranger to volatility, with unpredictable twists and turns that can test even the most seasoned investors. However, turbulent times need not be daunting. In this blog post, we will explore strategies to help you navigate volatile markets with confidence, turn uncertainty into opportunity, and make informed investment decisions during challenging times.
1. Stay Informed, Not Overwhelmed
During periods of market volatility, it's essential to stay informed about market developments and economic indicators. However, avoid becoming overwhelmed by constant news updates and opinions. Focus on reliable sources and maintain a balanced perspective.
2. Diversify Your Portfolio
Diversification is a time-tested risk management technique. Spread your investments across different asset classes, industries, and geographic regions. A well-diversified portfolio can cushion the impact of volatility on your overall holdings.
3. Set Clear Goals and Stick to Your Plan
Define clear financial goals and create an investment plan tailored to your objectives and risk tolerance. During turbulent times, emotions may tempt you to deviate from your plan. Stay disciplined and trust in the strategy you have set forth.
4. Consider Defensive Investments
Explore defensive investments, such as bonds, dividend-paying stocks, and precious metals. These assets may provide stability during market downturns and act as a hedge against heightened volatility.
5. Focus on Quality
In uncertain times, prioritize quality over speculative bets. Look for companies with solid fundamentals, stable cash flows, and strong balance sheets. Quality assets are better equipped to weather economic storms.
6. Assess Long-Term Value
Volatility can create buying opportunities. Look for high-quality assets that have been oversold due to market sentiment rather than inherent flaws. Assess their long-term value and potential for recovery.
7. Implement Stop-Loss Orders
Use stop-loss orders to protect your capital from significant losses. Set stop-loss levels that align with your risk tolerance and allow you to exit positions if the market moves against you.
8. Avoid Panic Selling
Resist the urge to panic sell during market downturns. Selling low locks in losses and may hinder your ability to benefit from potential market rebounds.
9. Focus on Risk Management
Adopt prudent risk management practices. Only allocate a portion of your portfolio to higher-risk assets and avoid overexposing yourself to individual positions.
10. Seek Professional Advice
If navigating volatile markets feels overwhelming, consider seeking advice from a financial advisor. A professional can help you assess your financial goals, devise a tailored strategy, and stay on track during turbulent times.
Conclusion
Volatility is an inherent part of financial markets, but with the right strategies and a disciplined approach, you can navigate turbulent times with confidence. Stay informed, diversify your portfolio, and focus on long-term value rather than short-term fluctuations.
Remember, every market cycle presents opportunities. Embrace volatility as a chance to refine your investment approach, grow your wealth, and turn uncertain times into prosperous outcomes.
Happy investing, and may your journey through volatile markets lead you to a more secure financial future!
Bearmarket

The MA 20, The RSI, and Another Bull RunWelcome back to my new long-term analysis. After we called the exact bottom in our last analysis, I am now showing what might happen next with the BTC price.
Today, we are looking at the monthly BTC/USD Chart.
With every BTC halving (dashed vertical lines) the chart is above the orange line, the monthly MA20 . The monthly MA20 decides whether the overall sentiment can be seen as bearish or bullish. A break above the MA20 after a successful crossing of the RSI (purple line in the RSI chart) and the MA7 of the RSI (yellow line in the RSI chart), sets the start of a new bull run as seen in 2019 and 2015. I’ve marked these important points with green circles . For visibility reasons, I left out the example from 2015, but you can easily recreate and see that it applies to that year as well. Whenever the chart is above the MA20, it doesn’t fall below it again until the beginning of the next bear cycle (the Covid-Crash remains an exception, as always).
So, the logical summary to determine a new bull run is the following:
Initial position: Chart has bottomed out (see my last analysis to find out how to detect the BTC bottoms) but is still below the MA20.
Step 1. RSI crosses the MA7 RSI to the upside.
Step 2. Chart crosses the MA20 to the upside.
Et voilà, we found the new beginning of the next bull run.
But where do we close our long positions?
Again, with the help of the RSI crossing the MA7 RSI we can also determine not the exact cycle top, but a precise area where we should close our long positions. When the RSI is in the oversold area (RSI above 80) and also crosses the MA7 RSI, but this time to the downside, we can consider the bull run over. I’ve marked these important points with red circles .
And, what’ next?
I did a little forecast to show what I think the future price movement for BTC can look like. We are facing a small mini-bull-run up to ~45-50k (~Dec 2023). After that, the price gets rejected quite heavily and stays close to the MA20, but always remains above it, until BTC is ready to take off for the next bull run which I think, based on the past timings, is around December 2024. The bull run top can be reached within half a year and could bring the price up to 170k, if not even more.

$BTC -Range Bound *12hr- CRYPTOCAP:BTC continues trading within a Tight Range of 2K,
dancing tango with range's bottom and ceiling,
until it doesn't.
40.000$+ per #Bitcoin is not as far fetched from here,
all Bitcoin gots to do is break current range to the upside before resuming higher.
Besides that, the awaiting Feds Rate Hike decision will impact direction of CRYPTOCAP:BTC
and other Financial Market sectors.
Breaking down from the range, upcoming supports are EMA200 catching up to 12Hr(tf),
Demand Zone during impulsive price action in 1Hr(tf) + a small support trendline.
If all these zones fail to provide support assuming a range breakdown headed South,
watch for S/R zone 24K-25K to catch a decent bounce,
welcoming great probability outcome Longing on Derivatives .
Remain Patient !
Until the next confirmation
TRADE SAFE
*** Note that this is not Financial Advice .
Please do your own research and consult your own Financial Advisor
before partaking on any trading activity based solely on this Idea

BNBUSDT up-to-date expanding endingJust updating that 30m chart, in which price action (micro triangle break) seems to be igniting the terminal leg downward v of the impulse wave 3 inner a right-angled structure, likely an expanding ending diagonal. Plus hidden divergence on Chaikin Money Flow.


Banknifty 45600 15min Creating Head and Shoulder Below 4595015min
Creating Head and Shoulder Below 45950 activation
Target Banknifty 45600
RSI
ADX
200 EMA 100 EMA 50 EMA

Finnifty 20350 15min Creating Head and Shoulder Below 20500
15min
Creating Head and Shoulder Below 20500 activation
Target Finnifty 20350
RSI
ADX
200 EMA 100 EMA 50 EMA

BNBUSDT update 4h - BEARFLAGBNBUSDT bearish scenario on 4h chart. Price action expected as a bear flag pattern breakdown, plus reciprocal AB=CD harmonic pattern plus Chaikin Money Flow bearish divergences in confluence w/ greater demand zone.

BNBUSDT Potential Bear ActionPotential bearish scenario to this asset. Price action is suggesting a further drawdown to the 239USDT demand region as the actual pullback seems to be accomplished. The reciprocal AB=CD pattern projection is reinforcing this idea, as a Head and Shoulders pattern is likely in formation. Thus, on this hypothetical 30m scenario, the price can made a ranging interacting w/ the neckline. Chaikin Money Flow hidden divergence & below zero + Awesome oscillator twin peaks in formation + Fisher Transform bear crossing.

BTC - Double-top pattern formingThe price has been observed to form a double-top pattern accompanied by a significant bearish divergence on the weekly timeframe. However, it is essential to note that if the price surpasses the resistance zone, a potential upward movement toward 35k can be expected. Conversely, if the price breaches the support trendline, a decline to 23k is likely.
Monitoring the fair value gaps below the current price levels is advisable, as they tend to be filled over time. Given the numerous indicators indicating a substantial bearish move, it is anticipated that a bearish outcome will occur soon.
Moreover, it is worth noting that the bear-market probability index is currently very high, indicating an inevitable occurrence of a significant bearish move.

DOTUSDTPOLKAUSDT is preparing for downside ? As the instrument break the inclining trendline and also broke through the 100EMA , seems like it is further heading to downside.

USDJPY SHORT SIGNAL(CONTINUATION)As price was trading down a pullback was experienced after a strong BOS at price level 138.400 and 139.100,the initial pullback leg created sell-side liquidity(THE X LINE) when it failed to continue with a rally to the upside and then went on to fail to break it with two successive legs after liquidity was created .A trend line was drawn under the third leg that went on to try to break the sell-side liquidity which failed to break it and created a wick-based bearish order block on top of the sell-side liquidity spot signaling a continuation to the downside.
1.PRICE BROKE THE TRENDLINE AFTER THE BEARISH ORDER BLOCK AND WENT ON TO MITIGATE IT(MY ENTRY POINT FOR LAST WEEK)
2.As shown on the chart a few levels of support/resistance were outlined to predict future movement for entry point 2
AWAIT ENTRY SETUPS FOR BEARS ON LOWER TIMEFRAMES.

idea on COMP Observing the market for 2 years, when an altcoin is interesting to a big player, when reaching low prices for the asset, there is mostly a strong upward movement (means that it is selected).
Therefore, it is useless to hope that this growth will be endless.

DE40 FUTURE TREND(BEARISH)CAPITALCOM:DE40 Price on the 4H timeframe has almost completed its upside move to mitigate the bearish order block and take out the inducement level to signal a brewing downtrend. ENTRIES CAN BE EXPECTED NEXT WEEK OR TWO WEEKS TO COME.
STAY PUT FOR UPDATES

US100 SHORT SKILLING:NASDAQ As shown on the weekly timeframe price went on to take out our inducement zone and mitigate the weekly bearish order block with long and impulsive candles, this weekly analysis concludes that for the next coming months we can maintain a bearish sentiment unless willing to trade pullbacks which will be bullish. Price will be on an overall bear trend for the next coming 3-6 months if fundamentals are on our side, BUT PRICE IS EXPECTED TO PRDUCE A CHOCH ENTRY SETUP IN THE NEXT 4-8 WEEKS(expect updates anytime)
1.possible levels for pullbacks will be: 14550 / 13573 / 12898 / 11735,price will likely bounce of from these levels before becoming bearish again. From these levels we can await bullish setups on lower timeframes (3/5/15/30/45 min and the 4h )
2.Proper bearish setups will start to form now on lower time frames
Expect entry updates any time from now.

EUR/USD BEARISH PRICE ACTIONI'm expecting this pair to visit the green zone marked in the chart. I'm also expecting the pair to form DT there.
there is also a possibility that the price start falling before reaching this zone( it's unlikely to happen, but expect the unexpected in financial market). So if you can add a sell position here, do it, other wise wait for a confirmation.
Please ignore the target zones I marked on the chart( not yet conformed). Just focus on the sell zone for now.
will update later.
Have a safe trade!
Fifi


EUR/JPY BEARISH PRICE ACTIONEur/jpy formed BT. I'm taking a short trade to the targets as shown in the chart. notice the bearish divergence of MACD. Be aware that this pair is very bullish, it may continue up from the first swing target.
Have a safe trade to all!

GBP/JPY BEARISH PRICE ACTIONIf you like, you can take this swing short trade to the 4H Demand zone shown in the chart. the price is showing LL and MACD is showing bearish divergence.
Have a safe trade to all!

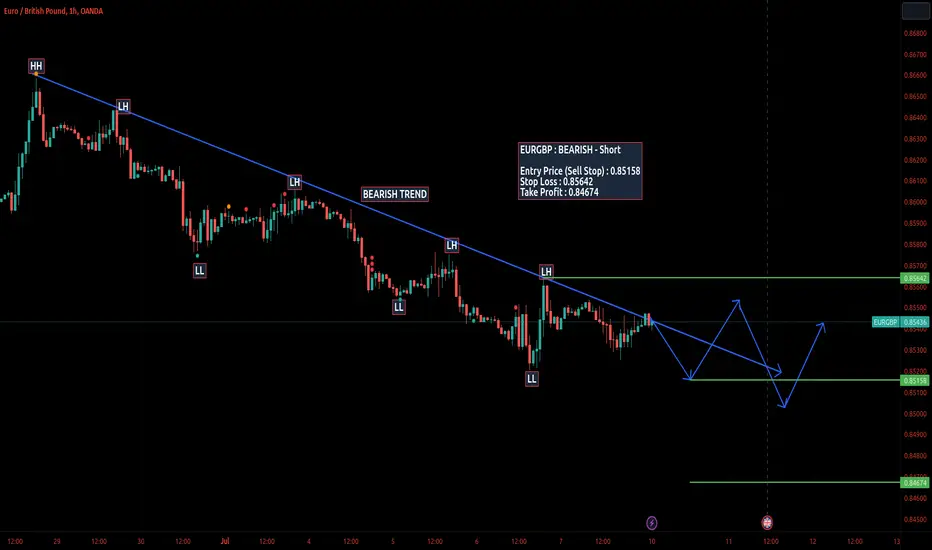
EURGBP Bearsh EURGBP : BEARISH - Short
Entry Price (Sell Stop) : 0.85158
Stop Loss : 0.85642
Take Profit : 0.84674
BNBUSDT ABCD projecting final downward wave-vThe price action is trading in the upper band of this micro bear flag, key level. Expecting a downward leg to the demand zone, as the ABCD reciprocal (0.382:2.618) is targeting the region.

DOTUSD : BEARISH!!!its showing bearish trend as accompanied with LHs and LLs.
possible entry location to profit this bear is as follow
Sell Order (Entry Point) : 5.12
SL : 5.3 (0.06 under previous LH)
TP1 : 5.29
TP2 : 5.30
Risk 2%

Bitcoin's road to 15kI think btc will start going down and tap that 20k region , after that a little push to the upside at around 22k before going down and tapping that 15k region.
