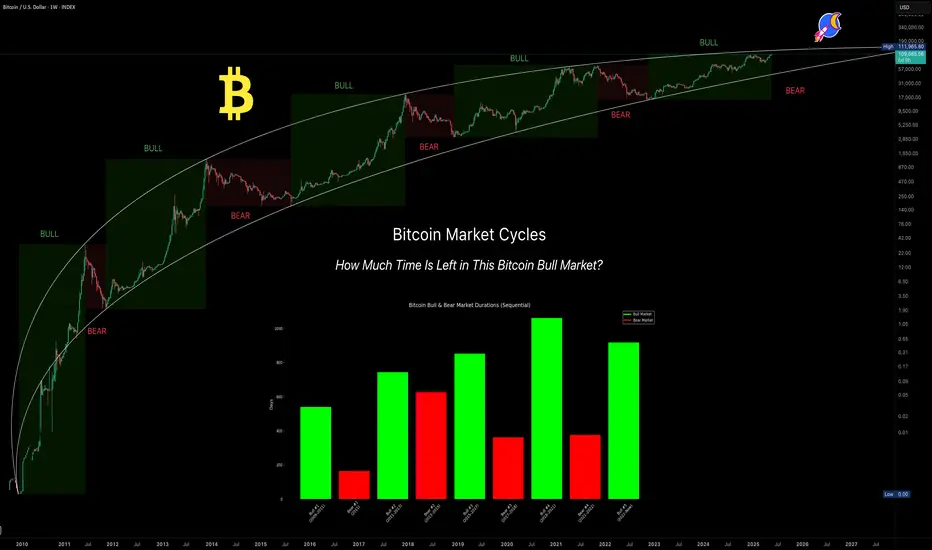
Bitcoin's Market Cycles — Are We Nearing the Top?Bitcoin is approaching a critical moment and the signs are everywhere.
After more than 900 days of steady bull market growth, BTC now flirts with all-time highs (ATH) while momentum stalls, liquidity thins, and emotions run hot. You might be asking:
Are we nearing the cycle top?
Is now the time to de-risk or double down?
What comes next?
This isn’t just a question of price. It’s about timing, structure, and psychology.
In this analysis, we’ll break down Bitcoin’s historical cycles, the current macro structure, the hidden signals from Fibonacci time extensions, and how to think like a professional when the crowd is chasing FOMO.
Let’s dive in.
📚 Educational Insight: Understanding Bitcoin Cycles
Bitcoin doesn’t move in straight lines, it moves in cycles.
Bull markets grow slowly, then explode. Bear markets fall fast, then grind sideways. These rhythms are driven by halving events, liquidity expansions, and most importantly: human emotion.
Here’s what history tells us:
Historical Bull Markets:
2009–2011: 540 days (+5,189,598%)
2011–2013: 743 days (+62,086%)
2015–2017: 852 days (+12,125%)
2018–2021: 1061 days (+2,108%)
2022–Present: 917 days so far (+623%)
Bear Market Durations:
2011: 164 days (-93.73%)
2013–2015: 627 days (-86.96%)
2017–2018: 362 days (-84.22%)
2021–2022: 376 days (-77.57%)
💡 What does this tell us?
Bull markets are growing longer, while bear markets have remained consistently brutal. The current cycle has already surpassed the average bull run length of 885 days (cycles #2–#4) and is quickly approaching the 957-day average of the two most recent cycles (#3 and #4). That makes this the second-longest bull market in Bitcoin’s history.
⏳ 1:1 Fibonacci Time Extension — The Hidden Timing Signal
In time-based Fibonacci analysis, the 1.0 (1:1) extension means one simple thing: this cycle has now lasted the same amount of time as previous cycles — a perfect time symmetry.
Here’s how I measured it:
Average bull market length #2–#4(2011–2021): 885 days
Average bull market length #3–#4(2015–2021): 957 days
Today’s date: May 27, 2025 = Day 917
✅ Result: We are well inside the time window where Bitcoin historically tops out.
You don’t need to be a fortune teller to see that this is a zone of caution. Markets peak on euphoria, not logic and this timing confluence is a red flag worth watching.
🗓️ "Sell in May and Go Away" — Not Just a Meme
One of the oldest market adages is showing its teeth again.
Risk assets — including Bitcoin — tend to underperform in the summer months. Why?
Lower liquidity
Institutional rebalancing
Exhaustion from prior run-ups
Vacations and reduced trading volumes
And here we are:
Bitcoin is hovering near ATH
It's been in an uptrend for 917 days
We just entered the time-extension top zone
Liquidity is thinning across the board
You don’t need to panic. But you do need to think like a professional: secure profits, reduce exposure, and wait for structure.
😬 FOMO Is a Portfolio Killer
This is where most traders make their worst decisions.
FOMO (Fear of Missing Out) isn’t just a meme — it’s the reason so many people buy tops and sell bottoms.
Before entering any trade right now, ask yourself:
Where were you at $20K?
Did you have a plan?
Or are you reacting to headlines?
📌 Clear mind > urgent clicks
📌 Patience > chasing green candles
📌 Strategy > emotion
Let the herd FOMO in. You protect your capital.
Will This Bear Market Be Different?
Every past cycle saw BTC retrace between 77%–94%. That was then. But this time feels… different.
Here’s why:
Institutions are here — ETF flows, sovereign wealth funds, and major asset managers
Regulation is clearer — and risk capital feels safer deploying in crypto
Supply is tighter — much of BTC is now held off exchanges and in cold storage
While a massive crash like -80% is less likely, that doesn’t mean a correction isn’t coming. Even a 30%–40% drop from here would wreak havoc on overleveraged traders.
And that brings us to…
🚨 Altseason? Or Alt-bloodbath?
Here’s the hard truth:
If BTC corrects, altcoins will crash — not rally.
Most altcoins have already seen strong rallies from their cycle lows. But if BTC drops 30%, many alts could tumble 50–80%.
Altseason only happens when BTC cools off and ranges — not when it dumps. Don’t get caught holding the bag. Be tactical. Be disciplined.
So Where’s the Next Big Level?
You may be wondering: “If this is the top… where do we fall to?”
Let’s just say there’s a very important Fibonacci confluence aligning with several other key indicators. I’ll reveal it in my next analysis, so stay tuned.
🧭 What Should You Do Right Now? (Not Financial Advice)
✅ Up big? — Take some profits
✅ On the sidelines? — Wait for real setups
✅ Emotional? — Unplug, reassess
✅ Are you new to Trading? — study, learn (how to day trade) and prepare for the next cycle
The best trades come to the calm, not the impulsive.
💡 Final Words of Wisdom
Bitcoin rewards discipline. It punishes emotion.
Right now is not about catching the last 10% of upside — it’s about:
Watching structure for potential trend change
Measuring risk
Avoiding overexposure
Protecting what you’ve earned
📌 The edge isn’t in indicators. It’s in mindset. Stay prepared, stay sharp because in this market…
🔔 Remember: The market will always be there. Your capital won’t — unless you protect it.
The next big opportunity doesn’t go to the loudest.
It goes to the most ready.
_________________________________
Thanks for reading and following along! 🙏
Now the big question remains: Is a bear market just lurking around the corner?
What are your thoughts? Let me know in the comments. I’d love to hear your perspective.
_________________________________
If you found this helpful, leave a like and comment below! Got requests for the next technical analysis? Let me know.
Bearmarkets
Historical Comparison of Vanguard Sector ETFsQuick comparison chart to see which performed better (or worse) during bull and bear markets.
It's not always a straight-forward answer, and more variables involved.
But... should give you an idea all things else equal regarding ticker choices and weights.

2014 & 18 Bear Markets imposed on current 2022 Bear Market PAFor an idea of what is in the realms of possibility with other bear markets for BTC (ignoring the current macro landscape); this post overlays the 2014 and 2018 bear markets over the current 2022 Bear Market PA.
Do we have more to drop?
Have we already put in our cycle bottom and are in our current cycle bottom accumulation trading range?

Comparison of BTC bear markets (2011,2015,2018,2022) Part 3On the chart are four bear markets. I decided to add the 2011 bear market too.
All three green lines are the tops of bull cycles, and the red lines are the bottoms of the bear markets.
As you can see, previous bottoms never touched the tops. Here are some metrics:
1) from a lower low in 2015 to a higher high in 2011 is around an 80% difference.
2) from a bottom in 2018 to a top in 2015 is a difference of around 60%.
3) in the present time, we have a distance of 22%. Of course, it has an explanation because BTC price has roses thousands of times.
80% - 60% - 22% this distance shrinks 1.5 and 3 times.
Also, a significant indicator is a volume during bear markets.
2011 - 7.9
2015 - 14.2
2018 - 13.5
2022 - only 4.4 compared to previous declines, it is too low numbers, but let's look into an alternative idea that the fourth bear market began in APR 2011, and it makes some sense because the volume is 10.2
As I mentioned in part 2 of my analysis, I am waiting for the last movement down into the area between 200 days EMA and MA after the bounce (correction) to the 33000-34000 zone.
Nevertheless, if the Federal Reserve System will fight inflation and not raise interest rates anymore, plus if the global situation of geopolitics will change to positive and stable, I will shift my plans and consider that the 25300 level was the bottom and we will have the third pick.
May the profit be with you!

Comparison of BTC bear markets (2015,2018,2022) Part 2You can see the second, third and present fourth bear markets on the chart.
The second and third had the same pattern of three movements (waves) down:
1. 0 - A
2. B - C
3. D - E
I depicted the same movement in the present situation based on 200 days of EMA and MA.
And here are such exciting historical circumstances. Look closely at the previous bottoms of 2015 and 2018. They were formed between 200 EMA and MA.
We can make our biases based on history and predict that price will build something similar this time.
I also drew arrows showing where strong wicks were in the past and the range of these movements and compared them with potential wicks that we can expect shortly.
May the profit be with you!
P.S. I will write the third part with my conclusions.

S&P 500 ---→ IN FOR A DEEP CORRECTION. MEAN REVERSION PENDING.S&P 500 IS IN FOR A DEEP CORRECTION.
Monthly SPX Regression Channel, spanning 40 years, with bands of +4/-4 standard deviations.
This is a long-term channel showing a Normal Distribution of SPX price occurrences.
At least 95% of the price occurrences occurred within the Comfort Zone, the blue area between +2/-2 stdev as it should be.
For 14 months (3.54% of the total bars) price has come out above the Comfort Zone, and even beyond +4 stdev.
In an uptrend channel this type of action commands a Mean Reversion most of the time.
Because this channel and its bands are dynamically calculated, the only alternative is for the price to stay out of the Comfort Zone until the channel adapts or accommodates (widens) to engulf the new prices, but in this case everything points to a MEAN REVERSION WITHIN THE NEXT 12 to 24 months.
THEREFORE SPX IS GOING LOWER.
Currently the Comfort Zone is between 3632 / 1818
Bear markets are not cleared up in a few days or weeks. They take time to unwind.
Bear market rallies: Trade'm, but don't Trust'm
We wrote an article about this channel on Feb-21-22

BTCUSDT - UpdateHi All,
As we have discussed in our previous analysis (see the link below), BTCUSDT broke below the mini-bull uptrend line from January and bounced off the 1st support level at 38K.
Now, if BTC can break above the local downtrend line, would expect a move up possibly to 41,800 resistance line. Otherwise, it would break the 38K support line and sell to the 2nd support line at 35K.
Our overall market outlook is bearish due to macro economics and the world events.
Thank you for your support!
* Not a financial advice and please do your own DD.

BITCOIN PRICE VS MACD Fractals Comparison (Past 2 Bullruns)This weekly-chart of BTC represents how previous rallies were followed by deeper corrections all the while comparing them with MACD. We'll notice some similar price movements, fake-outs and then breakouts.
(i) The cycle starts after making an ATH by a big and strong impulse during the bull market, subsequently there's always a major pullback, hence a Bear Market. After this pullback there comes a significant upside move which causes some undeveloped signals leading to FAKEOUTS (in white ellipse) which makes it look like the end of the bear market but only cause potential losses.
(ii) At the same time the MACD signals the "almost" crossovers which aligns with the bullish price action after a pullback leading us to believe a genuine breakout which later turns out as a FAKEOUT but if we look below the baseline (0 value in MACD) at -0.21 whenever there's a bullish crossover it acts as the beginning of next BIG MOVE and an actual BREAKOUT.
(iii) After the BREAKOUT (white diagonal rectangle) there comes the next phase, another big rally with more new market participants, much higher volumes which historically elevates the price in a PARABOLIC way taking prices beyond the previous ATH towards a new ATH (CRAZY MARKETS = CRAZY RETURNS) and eventually to an end of the rampant speculation.
(iv) And so the cycle repeats.
which brings us back to the current scenario that is half-way across the cycle meaning we are nearing the fake-out zone and we must stay awared and avoid getting trapped in the short squeeze or bull trap. Factually, the price should act accordingly; nevertheless, we know how BTC has never ceased to surprise us in the past. Let's just observe for now and not rush getting trades.
P.S - Too much info on the chart, for simple understanding just focus on the MACD crossovers and Price breakouts.
CryptoCuriousOfficial 📥

$SPX Secular Bulls and Bears Long term view. Green = secular bull markets. Red = Secular bear... could have 100 more months of this.
TVC:SPX moon


Master Buy & Sell "Bitcoin (BTC) Cheat SheetBULL MARKET TOPS = A TAD BEFORE 2nd BLUE LINE FROM PREVIOUS PURPLE LINE
BEAR MART BOTTOMS = 3rd BLUE LINE FROM PREVIOUS PURPLE LINE
GREEN ARROWS = BUY
RED ARROWS = SELL
*Blue & Purple lines are 1 year apart from March each year & clearly call the bottoms and tops of the Bitcoin cycles. Nothing special, but this gives a rough idea of when to buy and sell. I was originally trying to find confluence with the halving dates, but this seemed to work out perfectly, so I couldn't ignore it. Of course, Bitcoin can diverge, but the halving cyclical nature of every 4 years really keeps Bitcoin cycles fairly predictable. The good news is that we still have quite some time to go until the top of this cycle and of course there will be corrections along the way. Happy Trading!!!!

Copper Gold ratio - Yield Us Treasury 2 Years It's great discovery , the ratio copper gold anticipates Yield Us treasury 10 years and then , the difference of Yield 10y and Yield 2y anticipates bear market .....
