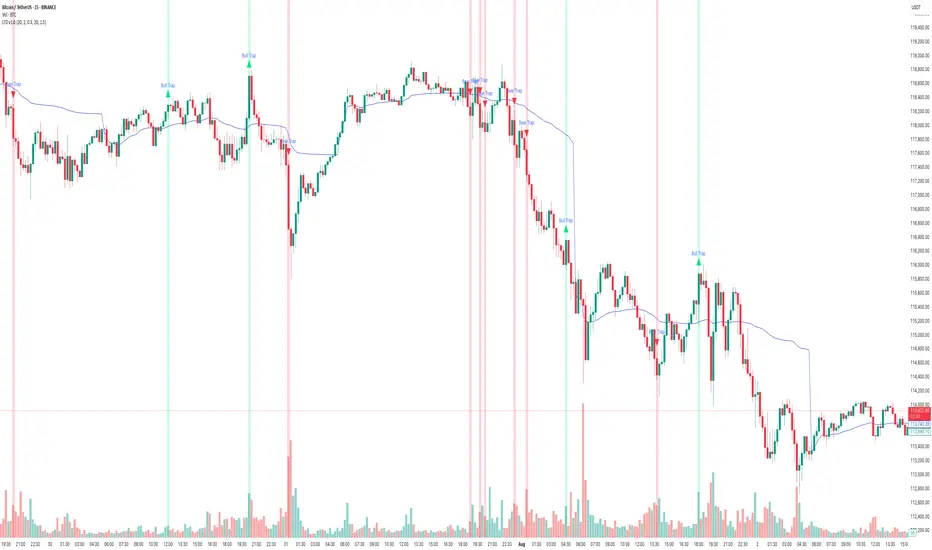
How to use Free TradingView Indicator to detect Liquidity TrapsPerformance on Shared BTC/USDT Chart
Indicator : Liquidity Trap Detector (LTD)
Timeframe: 15-sec (as per chart)
Observation Period: Full session visible in the screenshot
1. Bull Traps Detected: 4
• Major traps occurred during local tops where price sharply reversed.
• Example: ~19:15 and ~21:00 marked strong reversals after fake breakouts.
2. Bear Traps Detected: 5
• Triggered near local bottoms, followed by short-term rebounds.
• Example: ~22:15 and ~00:30 triggered after sudden downward sweeps.
3. Accuracy:
• Approx. 70–75% of traps correctly led to meaningful reversals.
• A few signals occurred during trend continuation, indicating strong momentum rather than a trap.
4. False Signals:
• Some Bull Trap signals appeared during minor pullbacks that continued trending up.
• Filtering with cooldown periods or trend filters (e.g., EMA alignment) can reduce noise.
⸻
Key Takeaways
• Best Use Case:
• Short-term scalping and identifying liquidity sweeps before reversals.
• Works well in ranging or high-volatility conditions.
Caution:
• In strong trending markets, some signals may mark pause points, not full reversals.
• Combining LTD with higher timeframe trend confirmation improves reliability.
Beartrap
Wkly Market Wrap: Nifty Under Pressure, S&P 500 Hits Record HighThe Nifty 50 closed the week at 24,968, down 180 points from the previous week's close. It traded within a tight range, posting a high of 25,255 and a low of 24,918—perfectly aligning with the range I’ve been tracking between 25,600 and 24,700.
As I’ve been highlighting over the past few weeks, the monthly chart continues to show weakness, and now even the weekly chart is starting to reflect bearish signals. This growing weakness is a notable concern.
What to Watch for Next Week:
If Nifty sustains above 25,100, we could see a potential rebound toward the 25,400–25,450 resistance zone.
However, a breakdown below this week's low of 24,918 opens the door to a retest of key support near 24,500.
What’s interesting is that, despite Nifty’s indecision, the number of bullish stocks on the monthly time frame has increased significantly. Last week, there were 18 such stocks on my radar; now that number has jumped to 26, even after excluding about 10 others that showed bullish patterns but had high volatility.
This divergence—index showing weakness while quality stocks turn bullish—could indicate a possible bear trap being set by institutional players. If true, we might see a sharp short-covering rally after a final shakeout.
Nifty Outlook:
For the upcoming week, I expect Nifty to remain range-bound between 25,400 and 24,500. A decisive breakout or breakdown from this range could lead to sharp directional movement, so traders should stay alert.
Global Markets: S&P 500 Soars to New Highs
The S&P 500 closed at a record high of 6,296, with a weekly high of 6,315 and low of 6,201. The index remains in strong uptrend mode.
A breakout above 6,315 could see it testing 6,376, 6,454, and potentially 6,500 in the coming sessions.
My next major Fibonacci target is 6,568.
As long as 6,149 holds on a weekly closing basis, I continue to view every dip as a buying opportunity.
Final Thoughts:
The Indian markets are sending mixed signals, with the broader index showing caution while individual stock strength is quietly building. This divergence warrants a tactical approach—stay nimble, respect levels, and be ready for sharp reversals or breakouts.
Next week could be crucial. Stay focused, stay disciplined.

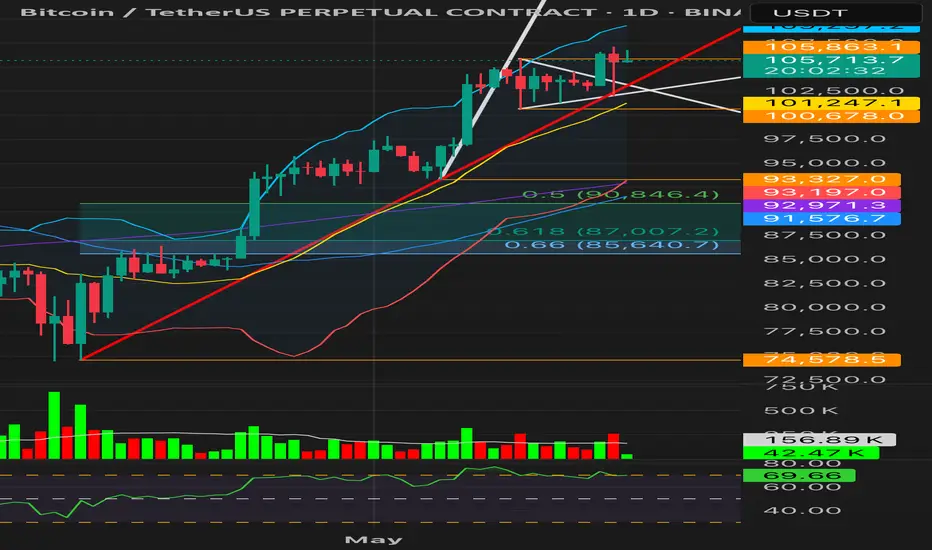
BTC – Distribution Denied. Reaccumulation Confirmed?
Timeframes: 1H (breakout retest) | 1D (macro continuation)
⸻
Updated Context
BTC invalidated the LPSY scenario on 1H:
• Price broke above the golden pocket (0.618–0.66)
• Also cleared the symmetrical triangle range high
• Now retesting the breakout with declining volume = classic reaccumulation behavior
The earlier 1H structure mimicked distribution, but failed to follow through. There was no markdown — instead, price reclaimed the range.
⸻
Daily Chart Support
• Second daily close above triangle apex
• RSI > 70 (currently ~70.3) → sustained bullish momentum
• Yesterday’s candle: long lower wick + above-average volume = demand stepping in
• Structure is building above $100K, which had been a major psychological barrier since Dec 2024
⸻
$100K – The New Base
BTC has tested and reclaimed $100K multiple times (Dec, Jan, May).
Now it’s acting as a macro accumulation floor, not resistance.
The longer price holds above this zone, the higher the probability of explosive continuation.
⸻
Next Levels to Watch
• Support (retest): 105.3–105.8K
• Validation: Strong 1H or daily close above 107.1K
• Targets: Upper BB (109.3K), then psychological round number → 110K
⸻
Conclusion
The bearish 1H thesis is now invalid.
BTC is above the range, retesting it, with macro structure and momentum on its side.
This is how reaccumulations trap early shorts and fuel the next markup.
#BTC #Bitcoin #Crypto #Reaccumulation #Wyckoff #Breakout #100K #TriangleBreakout #BTCUSDT #PriceAction
BEAR TRAP in SPY?🐻 BEAR TRAP in SPY?
After a sharp correction, SPY is showing a possible Bear Trap formation — right at the zone where the market often catches short sellers off guard.
📊 The pattern resembles the "First Sentiment Extreme" > Shakeout > Bear Trap phase from the classic market psychology cycle (see inset chart).
🔍 Supporting signs:
RSI bouncing off oversold territory (currently at 49.32)
MACD showing a bullish crossover forming
A strong bounce after a panic flush
If this is indeed a bear trap... 📈 we could be at the early stage of renewed optimism. The next few candles are crucial — confirmation could ignite a sharp reversal.
🧠 Don’t chase. Wait for confirmation. But stay alert.

Bear trap or the beginning of a bear market?A bear trap is on the border between a bear and a bull market. If it is really just a trap, then after a false breakout through support there should be a pullback and a subsequent run to the heights without any chance of buying on suitable positions. However, if it is not a bear trap, then it will only be a confirmation of the beginning of a bear market.

Death of ETH ?ETH is currently trading at a crucial support zone. A breakdown from this strong level could push ETH into a bearish trend, making recovery difficult.
However, if ETH manages to reverse from the $1,800–$2,000 support zone, there’s hope for a strong performance ahead. A further crash below this zone could have a severe impact on the entire Ethereum ecosystem.
The next two weeks will be critical—let’s see how things unfold. Hoping for a reversal from this support level!
Stay tuned for more updates.
Cheers,
GreenCrypto Team

Did Bitcoin Just Trick the Bears? RSI Says Yes!Bitcoin's recent price action suggests a potential bear trap, as the price sharply dipped below a key support zone before rebounding. The sudden breakdown may have triggered panic selling, but the rapid recovery and bullish divergence on RSI indicate that this could have been a false breakdown designed to shake out weak hands before a stronger upward move.
The price is now reclaiming levels above the previous demand zone, signaling a possible reversal. If Bitcoin sustains momentum and reclaims the $90,000 region, it could invalidate the bearish breakdown and push toward new highs.

BTC/USD Trading Setup – Bear Trap & Reversal PlayBTC has followed a former volatility setting where an initial sharp dump was followed by a reversion to prior levels with shrinking volatility, only to see another leg down extending 7% beyond the first drop. This pattern indicates a liquidity sweep before a potential structural shift.
Adding to the pressure, political instability has fueled market uncertainty, leading to a broad risk-off sentiment. Notably, gold is also at risk of a correction, and BTC is likely to dump alongside it rather than act as a hedge . This suggests a macro-driven selloff across multiple asset classes before any meaningful recovery.
BTC has now tested the 90K region five times, making it a key inflection point. A final dive below this level for a liquidity grab is highly probable before any major reversal. The tightening volatility percentages provide insight into an impending expansion phase, signaling that a significant move is approaching.
This setup presents an ideal bear trap opportunity. A final shakeout below 90K could lead to liquidity absorption, setting up a strong long-term positioning for a recovery. Smart entries on the final flush could offer a highly favorable risk-reward play for bulls.

BEAR TRAP? As illustrated, Im trying to visualize what could have been a bear trap.
Price actually consolidated at the ATH level, instead of selling off like it has done in the past when liquidating massively...
That behavior goes against "usual" patterns of selling, which leads me to believe that the obvious won't be that easy.
Until the market proofs otherwise, I don't trust the slight drop / reaction the market had after reaching ATH.
If this scenario plays out, I believe ASIA will do the dirty work of taking everyone out when they sleep in America's; potentially reaching psychological prices of 2950 - 2070 range with the help of LONDON.
Maybe then NY would look for a sell-off. MAYBE... because keep in mind we are coming from a very strong rebound on Monday after a sell-off that already took place ...
Of course, the market could consolidate once more how it did toward the end of 2024; however, the circumstances with TRUMP'S economic agenda is, as a matter of fact, giving gold more strength than ever before since its safe heaven demand just keeps increasing...
..
GOOD LUCK!

Different Types of W Patterns and How to Trade ThemHello dear KIU_COIN family 🐺 .
Recently, I decided to provide some educational content for you, my dear audience, and introduce some essential and basic trading terms.
Here’s what you should know: In these lessons, we will cover three different seasons:
🔹 Season 1: Reversal and continuation patterns.
🔹 Season 2: How to use RSI and other indicators to find good entry points.
🔹 Season 3: Definitions of Fibonacci and seasonality in trading.
Stay tuned for valuable insights! 🚀
✅ For the first section of 🔹 Season 1 , I’ll be covering W patterns— a well-known bullish reversal pattern :
As you can see in the chart above, we usually have three types of W recovery patterns , which are the most important ones for us. However, in this section, we just want to get a general understanding of them. In the upcoming section, we will learn how to trade them and explore how they actually appear on the chart and the story behind them !
✅ This is the first and most common type of W pattern:
✅ This is the second type of W pattern:
✅ This is the third type of W pattern:
Ok, guys; I think this is enough for today, and I hope you enjoyed this educational content. However, don't forget to ask your questions below and support me with your likes and follows for more of this content. 🐺🔥

Bitcoin is at a critical point - Consider this very seriously!!Hey family! Welcome to the wild world of cryptocurrencies, where the market can swing from one extreme to another in the blink of an eye. Crypto trading is known for its high volatility, which means prices can go up or down dramatically in short periods. Right now, many traders are buzzing with excitement, expecting Bitcoin to go on a bullish run. However, in such a dynamic market, it's always wise to consider the other side of the coin. Given the current sentiment, there's a good chance we might see some bearish moves too. So, while we're all hoping for the best, let's keep our eyes open for potential dips and prepare accordingly. Let's dive into today's analysis with that in mind!
Overview
This report provides a detailed technical analysis of Bitcoin (BTC) against Tether (USDT), focusing on the Ichimoku Cloud and chart pattern formation in combination.
Head and Shoulders Pattern
Pattern Description: The chart shows a Head and Shoulders pattern, which is a bearish reversal pattern following an uptrend. It consists of three peaks: the left shoulder, the head, and the right shoulder.
Identification on Chart:
Left Shoulder : Formed around mid-November.
Head : Formed in Mid December, peaking at approximately $108,000+.
Right Shoulder: Currently forming as of Jan 10, 2025, with a peak slightly lower than the head formed on Jan 7th.
Neckline : The neckline is drawn at the price level where the dips occur between these peaks and it is a wise choice to take the price zone as a whole in to consideration instead of just a specific price level. By this the neckline zone can be taken as between $89,800 & $92,400. A breakout below this level suggests a strong trend reversal.
Ichimoku Cloud Analysis
The Ichimoku Cloud, or Ichimoku Kinko Hyo, provides insights into support/resistance, momentum, and trend direction .
Here's the breakdown:
Kumo (Cloud): The cloud is formed by two lines, Senkou Span A and Senkou Span B, projected 26 periods into the future.
Current Cloud: The price has recently broken below from the upper cloud support, which was acting as support, and heading to the bottom of the cloud. This breakout below the cloud is a bearish signal indicating potential further downside.
Future Cloud : The future cloud (shaded area ahead) is sloping upwards, which traditionally would suggest bullish momentum, but given the current price action below the cloud and the reddish color it created, it might imply a false bullish signal or a potential resistance if the price attempts to recover.
Tenkan-sen (Conversion Line) and Kijun-sen (Base Line):
Tenkan-sen : This line (blue) is the average of the highest high and lowest low over the last 9 periods. It's currently below the Kijun-sen, reinforcing the bearish sentiment.
Kijun-sen: This line (red) is the average of the highest high and lowest low over the last 26 periods. The price is below both lines, indicating bearish momentum.
Chikou Span (Lagging Span) : This line shows the current price action shifted back 26 periods, providing a historical perspective.
Position: The Chikou Span is below the price action from 26 periods ago, which is another bearish signal.
Kijun-sen Cross : The Tenkan-sen crossing below the Kijun-sen while both are below the cloud strengthens the bearish outlook.
Key Price Levels
Breakout Level: $89,800 (Neckline)
Current Price: Around $92,750
Resistance: Cloud top around $95,000 - $97,000 - $100,000.
Support : Below the neckline, potential support around $85,000 to $82,000.
Volume Analysis
Volume: While high/average volume during the formation of the head might suggests strong participation, the volume during the right shoulder formation is lower, possibly indicating reduced buying interest.
Last Note : As a confluence the Trend Strength Index is also showing a declining movement both the weekly and daily charts even though it it at floor levels on the 4 Hr chart. This basically tells us that we might see some dip movements in the following days if volume continue dumping like it does in the past 3 1D candles.
Conclusion
Using the Ichimoku Cloud, we observe several bearish signals for Bitcoin:
The price is below the cloud, indicating bearish momentum.
The Tenkan-sen is below the Kijun-sen, and both are below the cloud, reinforcing the bearish trend.
The Chikou Span is below past price action, further confirming the bearish scenario.
Despite the future cloud showing an upward slope, the current price action suggests a continuation of the downtrend, with the Head and Shoulders pattern serving as a strong bearish indicator. Traders should consider this analysis in light of overall market conditions, keeping in mind that while the Ichimoku provides comprehensive insights, market sentiment and external factors also play crucial roles. Watch for any potential retest of the neckline or cloud for further confirmation of the trend.
But instead of the bearish breakout to the downward, if Bitcoin can rebound from the current price level, it is going to be yet another strong bullish move for a formation of a megaphone which is unlikely though.
For risk management, always consider using stop-loss orders, especially in volatile markets like cryptocurrency.
Stay Tuned for further updates.
With Regards.
CTE.

Symmetrical Triangle on the XRP Monthly chart ready to breakout?This Triangle can also be seen well on the weekly…and also valid on the daily chart but you have to scroll over to see the whole triangle on the daily. I chose the monthly chart for this idea though because it’s the easiest one to see all the key valid touches on both the bottom and top trendlines of the triangle.That bottom trendline has been holding for 3 years now and is super strong support. We just had a flash crash on the daily dip down below it and threaten to trigger what looks like a h&s on the daily chart (not shown here) however that was quickly bought up and with very little volume to show is looking to be a classic fakeout breakdown/bear trap. Still a decent amount of hours left in todays daily candle but as long as that candle closes green it is a very good sign that this triangle will likely be breaking upwards. *not financial advice*

The SP500 Bear TrapYesterday was a long day
As I lay in bed reading about
Candle stick patterns.
I kept thinking of another way to see through the current system am already using
Trading has so many mirrors and once you understand just one system
You can leverage it as a mirror.
This is what puts me ahead of the competition honestly
I don't think there be ever a day I don't
See a trading opportunity maybe it's because I pushed myself so hard to learn trading...I don't know
But there I not even one day which I can honestly say I dont see a trade to profit from
Look at this chart of SP500 SP:SPX
The 🐻 Bears have taken over.
They was a huge market crash ⬇️
But this is called a "bear trap "
It's the opposite of a "bull trap"
This when you really have to buy the dip..
Also notice the 3 step Rocket Booster Strategy
🚀 Price is above the 50 EMA
🚀 Price is above the 200 EMA
🚀 Price is in an uptrend
Knowing this strategy will boost your understanding of trends and mass psychology
Rocket boost this content to learn more.
Disclaimer ⚠️ Trading is risky please learn risk management and profit taking strategies because you will lose money wether you like it or not .
Also practice on a simulation trading account before you use real money

Euro Technical Analysis: EUR/USD Stalls Inside of Yearly HighEUR/USD has put in a very bullish outlay so far in Q3 trade. But last week saw bulls stall inside of the 2024 high and that brings questions to topside continuation in the pair.
EUR/USD continued the advance last week following the rate cut rally following the European Central Bank’s move two weeks ago. There was technical context for bullish continuation as the pair broke through the topside of a bull flag formation but, to date, buyers haven’t been able to push for a re-test of the yearly high at the 1.1200 handle.
There was seemingly an open door for a test of the highs last week as the pair showed three consecutive days of swing highs within 25 pips of that big figure. This week started with pullback but that also shows a bit of indecision as sellers were unable to test below last Thursday’s swing-low.
EUR/USD Bigger Picture
At this point it’s difficult to argue with the intermediate-term outlay in the pair, which has been decisively bullish since the rally began around the Q3 open. The pair was working around the 1.0700 at the time and as USD-weakness, prodded by a sell-off in USD/JPY, continued to drive DXY to fresh lows, EUR/USD continued its upward advance.
But taking a step back, the argument can be made that the pair remains in the confines of a longer-term range and last week’s respect of the 1.1200 handle further speaks to that, as that, itself, is a lower-high from the 2023 swing at 1.1275.
This sets up for an important few weeks as price remains within that shorter-term bullish trend into the Q3 close, with those very obvious resistance levels lurking overhead.
I had written about the US Dollar to finish last week, and if the USD is going to rally, it’s probably going to need some help from EUR/USD bears.
EUR/USD Shorter-Term Strategy
Sellers made a quick push at the start of this week’s trade but as noted above, they haven’t been able to make much of a mark yet. But – this does set up some additional lower-high context as last week’s stall around 1.1175 is inside of the prior high at 1.1200, which is inside of the 2023 high at 1.1275.
The 1.1140 level that I’ve been tracking in webinars is in-play as of this writing and there’s additional context for a possible lower-high up to prior short-term support, around 1.1155. If bears can defend that, the focus is on tests of deeper support. I’m tracking a Fibonacci level at 1.1081 that helped to bring the post-Fed bounce last week, and that’s followed by a swing at 1.1055.
After that is the 1.1000 level and that’s the price that was vigorously defended into and around the ECB’s rate cut.
Bears aren’t necessarily out of the woods on a first test below 1.1000, however, as the 1.09424 Fibonacci level could be a lead-in for bear trap potential on a bigger picture basis. That’s the 50% mark of the same Fibonacci retracement that set the high last year at the 61.8% (1.12697) and the low so far this year around the 38.2% (1.06152).
--- written by James Stanley, Senior Strategist

Cancellation of “Head-and-Shoulders” Pattern. Bears trapThe "Head-and-Shoulders" (H&S) pattern is considered a powerful trend reversal indicator. However, it can also become very costly for new traders. Yesterday, the S&P provided a great example of H&S cancellation. Traders who entered short on the break-out of the shoulders line (and Monday's low) incurred losses after the price returned to the previous day's range and rallied all the way up. Such scenarios happen more often than you might think.
To avoid being caught in such traps, it is important to consider two things:
1. Higher Level Context : In this example, the H&S pattern formed on the hourly time frame. But if we zoom out, we'll see that on the weekly chart, the price is in a strong uptrend, currently making new historical highs. This is a very bullish context, with buyers having full control over the price.
2. Price Behavior on the Break-out : Upon confirmation of a reversal pattern, you should expect sellers to jump in and drive the price down as fast as possible. It is "abnormal" to see the price returning to the previous range and gaining acceptance. This is a trigger that something is not right.
Some people will add volume analysis on the break-out, but I’m personally not a fan of it, especially for SPY.

Potential Ascending Triangle (NQ Futures)NQ Futures could be trying to setup an ascending triangle to catch bears short at the bottom with major upside potential with a breakout and confirm.
Will almost certainly coincide with data/news that will either play out a bear trap or a bull trap on the same timeframe for the next let the market takes.
Often these patterns forming at the bottom of a range end up being bull traps but anything can happen and it's best to be prepared for whatever happens.

Major Resistance
After rejecting off the L1 ( white line ) in the second week of January @48k my next target by default is the L2 ( red line ) @30k by the end of Q2 or beginning of Q3.
These support & resistance levels are calculated using my proprietary tool called LifeLines. Think of them as moving averages on steroids.
I doubt that this happens but in the case that we close the month of February above 48k then I will be waiting for a closure below again before entering another position. In other words I am very confident that we will see a greater pullback before continuing the greater trend to the upside.
Stop loss @49k

BTC: Short-Term Liquidity Hunt Before Bear Trap and DropBitcoin (BTC) is currently positioned for a short-term move targeting liquidity above the current highs, potentially luring in bears. This setup suggests a liquidity hunt, followed by a rebound from the heavily traded area, and then a push towards higher liquidity zones beyond the recent highs. It appears to be a tactical move to trap bears before a significant downturn. While the short-term outlook hints at a bullish trap, my global perspective remains bearish, anticipating a more substantial short position post-liquidity grab around the $44K level, possibly even higher. www.coinglass.com

Matic - Bullish Momentum BuildingPolygon (MATIC) has been trading within a horizontal accumulation pattern on the daily timeframe, attempting a breakout previously but lacking the strength to sustain higher levels. The recent breakout from the lower boundary of the accumulation range provides a renewed sense of strength, positioning MATIC for potential upward momentum. Additionally, on the hourly timeframe, the continuous confirmation of bullish intentions through bear traps contributes to the positive outlook.
🔄 Daily Accumulation and Breakout:
MATIC's extended consolidation within the daily accumulation pattern signaled a period of indecision and potential accumulation of positions. Previous attempts to break out to the upside were met with challenges, preventing sustained upward movement. However, the recent breakout from the lower boundary suggests a shift in dynamics, providing the necessary strength for potential growth.
🚀 Strength from Breakout:
The breakout from the lower boundary of the accumulation range grants MATIC a significant boost in terms of potential upward momentum. Successfully establishing a higher trading range could indicate a newfound market sentiment favoring bullish movements.
🔍 Hourly Confirmations and Bear Traps:
On the hourly timeframe, MATIC exhibits a pattern of continuously confirming its bullish intentions. The creation of bear traps, strategically inducing short-term downward movements, adds to the overall bullish narrative. These traps serve to shake out weak hands and provide additional fuel for faster growth.
💡 Trading Strategy:
Traders and investors may consider positioning themselves strategically in MATIC following the breakout from the accumulation range. Confirmations on the hourly timeframe, especially through the use of bear traps, can contribute to the overall bullish case. Implementing effective risk management strategies, such as setting stop-loss orders, is advisable.
🔮 Future Outlook:
The technical analysis suggests that MATIC is well-positioned for potential growth following the breakout from the accumulation range. Traders should remain vigilant and adapt their strategies based on real-time market data. The combination of the daily breakout and hourly confirmations, including bear traps, creates a favorable environment for bullish momentum. The cryptocurrency market's dynamic nature emphasizes the importance of flexibility and risk management in trading decisions.

ETH/USD POSSIBLE BEAR TRAP?!?!BITSTAMP:ETHUSD
🚀 Ethereum Update: Breaking Free from the Bear Trap! 🌕
Hey Crypto Traders! 🌐
Exciting times in the Ethereum market as we witness a breakout from the recent bear trap. 🐻 But don't fret, Hodlers – the charts are flashing some compelling bullish signals!
📈 Key Technical Indicators:
Waning Moon Bullish Signal: The waning moon is casting its bullish glow, signaling a period of consolidation before a potential upward swing. 🌙
100 Day EMA Bounce: Ethereum bounced off the 100-day EMA, showcasing strong support.
MACD Cross Confirmation: A bullish MACD cross adds weight to the positive outlook.
💡 What's Next?
Keep a keen eye on the green trend line. If Ethereum breaks above it, we might be looking at new heights. The waning moon, coupled with technical indicators, paints a promising picture.
🌐 Stay Informed, Stay Ahead!
#Ethereum #Crypto #Bullish #ToTheMoon #Breakout

Turning Traps into Profitable Opportunities ! TOP 3 PATTERNSTrading traps are a common occurrence in the cryptocurrency market. They can be created by a variety of factors, including market manipulation, technical analysis, and psychological biases. While traps can be dangerous for traders who are not prepared, they can also be a source of profit for those who know how to trade them effectively.
In this article, we will discuss three common trading traps and how to trade them profitably. We will also discuss how traps are created and how they can be used to your advantage.
What Are Trading Traps?
Trading traps are false movements in the price of a cryptocurrency that are designed to trick traders into taking a position in the wrong direction. They can be created by a variety of factors, including:
Market manipulation: Market manipulators may create traps to trick traders into taking positions that are in their favor. For example, they may buy a large amount of a cryptocurrency to drive up the price, and then sell it off quickly to create a sell-off.
Technical analysis: Technical analysts may use traps to take advantage of traders who are following technical indicators. For example, they may create a false breakout of a support or resistance level to trigger stop-loss orders.
Psychological biases: Psychological biases, such as fear of missing out (FOMO) and fear of loss (FUD), can also lead traders to fall into traps. For example, a trader who is afraid of missing out on a potential bull run may be more likely to buy into a false breakout.
In the example above, LINK was trading in a horizontal range for several months. The price then broke below the lower range boundary, which was a sign of a potential bear trap. However, the price quickly reversed and re-tested the lower range boundary. This was a good opportunity to enter a long position, as it showed that the trend was still in place.
How to Identify Trading Traps
There are a few things you can look for to help you identify trading traps, including:
Volume: A sudden increase in volume can be a sign that a trap is being set. This is because market manipulators or technical analysts will often need to buy or sell a large amount of cryptocurrency to create a false movement in the price.
Price action: A false breakout or fakeout is often accompanied by a sharp reversal in price action. For example, a false breakout of a support level may be followed by a sharp sell-off.
Technical indicators: Some technical indicators, such as the Bollinger Bands, can help you identify potential traps. For example, the Bollinger Bands may widen before a false breakout, which can be a sign that a trap is being set.
How to Trade Trading Traps
Once you have identified a trap, you can trade it in one of two ways:
Long trap: If you believe that the trend will continue, you can enter a long position on the re-test of the breakout level.
Short trap: If you believe that the trend will reverse, you can enter a short position on
the break of the breakout level.
Examples of Trading Traps
3.1 Triangular Trap Unveiled:
Discuss the bearish implications of descending triangles in technical analysis and their potential use as manipulation tools.
Explore how market manipulators engineer these patterns to trigger artificial stop-losses.
Case Study: NEAR's Triangular Intricacies:
Analyze NEAR's descent within a descending triangle and its unexpected breakout.
Offer insights into the motives behind orchestrating such traps and how traders can leverage these market dynamics.
Here are some examples of how trading traps can be created and traded:
Shakeout trap
A shakeout trap is a false breakout that is designed to trick traders into taking a position in the wrong direction. For example, a cryptocurrency may be trading in a horizontal range for several months. The price then breaks below the lower range boundary, which is a sign of a potential bear trap. However, the price quickly reverses and re-tests the lower range boundary. This is a good opportunity to enter a long position, as it shows that the trend is still in place.
Fakeout trap
A fakeout trap is similar to a shakeout trap, but it occurs after a trend has already begun. For example, a cryptocurrency may be in a bull market. The price then breaks above a resistance level, which is a sign that the bull market is continuing. However, the price quickly reverses and re-tests the resistance level. This is a good opportunity to enter a short position, as it shows that the bull market may be coming to an end.
Reversal trap
A reversal trap is when the trend of a market changes direction. For example, a cryptocurrency may be in a bull market. The price then breaks below a support level, which is a sign that the bull market is ending. However, the price quickly reverses and re-tests the support level. This is a good opportunity to enter a long position, as it shows that the bull market may be resuming.
The Art of Spotting Fakeouts:
Define the concept of fakeouts and unveil their potential as precursors to bullish movements.
Offer insights into distinguishing genuine breakouts from manipulative traps set by
market actors.
Case Study: ZIL's Quick Turnaround:
Uncover the Zilliqa (ZIL) chart, examining the deceptive fakeout beneath a pivotal horizontal level.
Emphasize the strategic importance of waiting for a retest post-fakeout as a confirmation signal.
Conclusion
Trading traps can be a dangerous but profitable part of cryptocurrency trading. By understanding how traps are created and how to identify them, you can increase your chances of trading them successfully.
Additional Tips for Trading Trading Traps
Use stop losses: Stop losses can help you limit your losses if you are wrong about a trade.
Be patient: Do not rush into a trade just because you see a trap. Wait for the

The bear trap is set. The 2023 bear trap
AS we can see on January 20th Bitcoin broke the down trend it has been in for over one year now. Recently the resistance was tested and was made in to support as Bitcoin took a strong bounce off of it. WE can clearly see this in the chart with the highlighted oval.
Above that we have the bear trap zone and the fomo zone A break and hold of the 25.4k level leads to the setting of the bear trap. This bear trap zone goes all the way to 32k above that is the fomo zone and it goes to 47k and possibly even higher. These ar eth e levels to look for in the coming weeks.
Another thing of note to look for is that Bitcoin could retest the break out zone at a later date {shown with the blue arrow} and as long as it holds it could then lead to the bear trap.
What to look for
The RSI will be a dead give away on what move comes first as I have drawn the down trend that it is in at the moment. If this should break above the down trend then it will do with the price and confirm the move.
Thanks for looking
Hit the like and subscribe for hot off the press charts.
WeAreSatoshi
Stay blessed in 2023.

GRT : Bear Trap and Ascending channelThe journey of Graph (GRT) has been marked by a strategic escape from a bear trap and a subsequent ascent into a bullish parallel channel. Let's delve into the dynamics that unfolded, highlighting GRT's resilience in the face of adversity.
Key Events:
Bear Trap at $0.08:
GRT found itself in a range-bound scenario, with a crucial support level at $0.08.
A sudden and sharp drop below this level initially appeared bearish, creating a trap for unsuspecting bears.
Swift Recovery:
Contrary to the bearish indications, GRT showcased remarkable resilience by swiftly recovering from the bear trap.
This rapid rebound hinted at strong buying interest and a potential change in market sentiment.
Technical Analysis:
Formation of a Bullish Parallel Channel:
GRT's price action post-bear trap reveals the emergence of a bullish parallel channel.
This channel signifies a more controlled and sustainable upward movement, often indicating a positive trend.
Successful Swipe from Previous Day's Low:
GRT strategically executed a swipe from the lows of the previous day, adding to the bullish narrative.
Such swipes often serve as confirmation of support levels and fuel the next leg of the upward move.
Trading Strategies:
Channel Trading Opportunities:
Traders may explore opportunities within the bullish parallel channel, considering long positions as the price respects the channel boundaries.
Identifying potential reversal or continuation patterns within the channel can aid in tactical decision-making.
Monitoring Key Levels:
Keep a close eye on critical support and resistance levels, including the $0.08 level, which previously acted as a pivotal point for GRT.
Breakouts or breakdowns from these levels could signal significant shifts in market sentiment.
Conclusion: Navigating GRT's Bullish Trajectory
GRT's ability to rebound from a bear trap and establish a bullish parallel channel underscores its resilience and appeal to market participants. Traders can leverage these insights to devise strategies that align with the current market dynamics.
🚀 Escaping Bear Traps | 📈 Bullish Parallel Channel | 💡 Strategic Trading Approaches
💬 Share your perspectives on GRT's recent price action and your strategies for navigating its bullish trajectory! 🌐✨
