There is another Bearish BPR zone below the current price.BTC/USDT Market Update – Clear, Detailed, and Easy to Understand (Even for Beginners)
Let’s take a look at what’s happening with Bitcoin (BTC/USDT) right now explained in a way that even someone new to trading can follow along and understand.
Recently, Bitcoin hit a new high it was climbing up steadily. But then, due to negative global news related to war, the market took a hit and started dropping sharply.
Currently, BTC is trading at a (BPR) this is a technical area that often acts as a strong resistance zone, where the price tends to face rejection and reverse.
👉 Right now, Bitcoin is struggling to move higher and appears to be getting rejected from this BPR level.
But here’s where it gets more interesting:
🔻 There is another Bearish BPR zone below the current price, and the market has already touched that zone once before bouncing upward.
So what's the current situation?
📍 If Bitcoin is able to break above the current Bearish BPR (the level where it’s trading now) — it would be a bullish sign, and the market may start rising again.
📍 However, if BTC fails to break this resistance level, then we could see another strong move to the downside, possibly heading back to lower support zones.
🚨 Key Takeaway:
This level — the one BTC is currently interacting with — is very important.
📌 Traders should keep a close eye on it.
📌 Let the market reveal its direction before making any decisions.
Remember:
⚠️ This is not financial advice. Always Do Your Own Research (DYOR).
Beginners

For those of you who bought XRP...I've known about COINBASE:XRPUSD for over a decade now. Time has brought tons of rumors, tons of hype, and tons of mistakes still being made by those new and experienced alike. For those of you holding strong pre $1.00, I commend you. For those of you who are bought high and are now riding the emotional roller coaster, consider these 3 things before you make a decision.
1. We are DIRECTLY in the middle of the range
Over 3 months of consolidation has taken place. With a high of 3.40 and a low of 1.70, this is a range for advanced traders. If you bought around 2.00 or under, Congrats! even though you didn't get in pre $1.00, there are alot of Big buyers that have been scooping up XRP at the 2.00 level.
For those of you that Bought 2.50 and above.
Ask yourself why you purchased XRP?
I ask you; Did you buy XRP to trade? or to invest? No they are not the same thing. Investing is long term, 3-5 years+. Trading is dealing with much shorter time windows, even if you are swing trading, Trading is Trading, and this takes a different skill set and mindset. so if you are investing, be happy that XRP is lower in price. if big money is Buying at 2.00, there is nothing stopping you from doing the same. If you are a beginner trader, consider our last point.
Buy with Buyers, Sell with Sellers
Sounds simple right? Here is something you may not know. Liquidity is what moves markets. If you have 100million that you have to invest for your clients in XRP, do you slap the market button? Absolutely not, in fact, you want to make yourself as small looking as possible. Why? YOU NEED PEOPLE TO SELL INTO YOU. Big firms (unless through dark pools) have algorithms make themselves look as small as possible, whilst accumulating and distributing shares efficiently. At the end of the day, These are the big players that move the markets big.
Do you need to know this? Not necessarily for the technical side, but for your emotions, your psychology? Yes this is important.
Find the buyers and sellers (I have them marked in my chart), and learn to play alongside them. You will get better pricing, feel great about your positions, and know if it goes against you, you can cut the trade off early and reposition.
Hope you enjoyed, and happy Trading!

DOGE Set for Big Moves: Will We See $0.40 or a Deeper CorrectionAlright, trading family, here’s the deal: DOGE looks like it’s heading toward $0.32–$0.33. From there, we’ve got a few possible waves to ride:
1️⃣ If we break through, we could hit $0.34, $0.36, $0.37, and maybe even $0.40 on the weekly levels.
2️⃣ If we pull back, watch for support around $0.31–$0.30 before a bounce higher.
3️⃣ A bigger correction could dip us to $0.27–$0.28 before the next push. If $0.27 breaks, we could go deeper.
Stay calm, watch the price action, and let the market show you the way. Always trade what you see.
Mindbloome Trading/ Kris

GBPJPYHello guys TechPips here this is my personal view on gbpjpy market as been bullish on daily and they are beginning to lose momentum or Liquidity since new high as been created so I am expecting a bearish run on daily in this new week we are entering so in my 1hr timeframe I am expecting the bears to break the trend and redirect the trend then I will look for an entry to swing for few days.
NOTE : Risk management is Important in trading so kindly apply it if you are join the ride. All action made by you based on your capital is your responsibility so trade with caution and be smart in taking trades.

All About the Head & Shoulders Pattern(Beginner-Friendly) Part.2Hello, everyone.
Today, I’m excited to share the second part of my educational series on chart patterns.
In this post, we’ll be focusing on the 'Head and Shoulders' and 'Inverse Head and Shoulders' patterns.
For those who missed the first part, you can catch up here:
↓↓↓
As always, I’ve kept the explanations simple and beginner-friendly. I hope this guide provides you with valuable insights!
Here’s today’s outline:
————
✔️ Outline
1. What is the Head and Shoulders pattern?
Definition
Key components
Characteristics
2. Head and Shoulders
Basic features
Examples
3. Inverse Head and Shoulders
Basic features
Examples
————
1. What is the "Head and Shoulders" pattern?
1) Definition
The Head and Shoulders pattern is a well-established reversal formation that appears after an uptrend and signals the potential start of a downtrend. It indicates that buying pressure is weakening and selling pressure is gaining momentum.
2) Key components
Left Shoulder: The initial peak, where the price rises and then pulls back.
Head : The highest peak, situated between the two shoulders, representing the final bullish push.
Right Shoulder: The third peak, which is typically lower than the head but similar to the left shoulder, signaling diminishing buying interest.
Neckline: A key support line drawn across the lows of the left and right shoulders. A decisive break below this neckline confirms the reversal and the beginning of a downtrend.
3) Characteristics
Reversal signal: The Head and Shoulders pattern marks a transition from an uptrend to a downtrend.
Easy identification: The structure is visually distinctive, with three clear peaks.
Neckline significance: A break below the neckline serves as a confirmation signal for the downtrend.
Volume dynamics: Volume typically rises during the formation of the left shoulder and head, decreases during the right shoulder, and surges again when the neckline is breached.
————
2. Head and Shoulders (Reversal from uptrend to downtrend)
1) Basic features
End of an uptrend: The Head and Shoulders pattern forms at the end of a bullish phase, signaling a weakening in buying strength.
Distinct peak heights: The head is always higher than the shoulders, which are generally symmetrical, though the right shoulder may sometimes be slightly lower, enhancing the pattern’s reliability.
Neckline as a trigger: The neckline acts as a critical support level. A break below it confirms the pattern and signals the onset of a bearish trend.
Volume confirmation: Volume increases during the left shoulder and head formations, weakens during the right shoulder, and spikes when the neckline is broken, confirming a potential sell-off.
Price target: After the pattern completes, the expected price drop is typically equal to the distance between the head and the neckline, providing traders with a target.
2-1) Example 1
In this example, we see a fakeout at the right shoulder, followed by a sharp decline.
After a brief retest of the neckline, the price broke through and continued its downtrend.
2-2) Example 2
In this chart, a fakeout occurred when the price dropped from the head and formed the neckline, misleading many market participants. After forming the right shoulder, the price successfully declined. There were two retests, which confirmed the reliability of the pattern.
————
3. Reverse Head and Shoulders (Trend reversal from downtrend to uptrend)
1) Basic features
End of a downtrend: The Inverse Head and Shoulders pattern typically forms at the end of a downtrend, signaling a potential reversal to the upside.
Formation of lows: Like the standard Head and Shoulders, this pattern consists of three lows—left shoulder, head, and right shoulder—with the head being the lowest point.
Neckline significance: The neckline is drawn across the highs of the left and right shoulders. A break above this line confirms the reversal and acts as a strong buy signal.
Volume pattern: Volume tends to decrease during the formation of the pattern but surges when the neckline is broken, signaling strong buying momentum.
Target setting: After the pattern is confirmed, the expected price rise is often equal to the distance from the head to the neckline, which helps traders set profit targets.
2-1) Example 1
After the Head and Shoulders pattern formed, the price broke above the neckline, successfully reversing the downtrend into an uptrend. A buy strategy would have yielded profits at the breakout point.
2-2) Example 2
In this example, a smaller Reverse Head and Shoulders pattern formed within the head of a larger pattern (see Example 3). After two successful retests, the price reversed into a strong uptrend.
2-3) Example 3
This example showcases the smaller Reverse Head and Shoulders pattern mentioned in Example 2, located within the head. After two successful retests, a buy strategy could have led to profits as the price reversed into an uptrend.
————
✔️ Conclusion
"Charts are the maps of the market."
The Head and Shoulders and Reverse Head and Shoulders patterns we’ve covered in this post are key signals that frequently appear in the market. Charts aren’t random—they are visual representations of market psychology and investor behavior. As traders, our role is to interpret these maps, navigate the market, and make informed decisions.
Investing is more than just buying and selling. Sometimes the market may move contrary to our expectations, while other times we seize opportunities and achieve success. Each experience is a chance to learn and grow. The more experience you gain, the more paths you’ll recognize on the chart.
Success in this market requires persistence, patience, and continuous learning. Understanding and analyzing chart patterns like the ones discussed here is just the beginning. I hope this post has helped you gain a deeper understanding of the market and make more informed decisions.
The market is always evolving, but within that evolution lies opportunity. The key is developing the ability to spot those opportunities. With knowledge, experience, and confidence, you’ll find greater success.
Stay prepared, and always listen to what the market is telling you.

Fibonacci Retracement style Bollinger Bands & Awesome OscillatorThe over idea behind the strategy is very simple.
We all know how to use Fibonacci Retracements and Bollinger Bands.
The indicator on top combines both using Fib levels in a Bollinger band fashion. (I did not make the indicator)
On the bottom we have the Awesome Oscillator (Also not my creation) reading on the 200 for accuracy.
The Oscillator is used to determine momentum and volume to indicate momentum loss and gain.
Using primarily Price Action and the Fib. Bollingers, we can determine reversals and determine with some accuracy where we're going.
This strategy has been tested, tested and more tested and has high accuracy, low loss and high gains.
It's a good choice for beginners and veteran scalpers alike.
Feel free to leave a comment below, ideas, criticism, ect. DM me if you nee any technical analysis, I have over a decade in the field and am always looking to help others.

Harmonics don't work...Here's how I find my set ups I thought I'd share with you guys the process I use to find my shark setups, this is a strategy I've back-tested and tested several times. I must say textbook harmonic talk poop, the values I use work but the set-up I see written for the shark uses different values. I noted this and thought about it for a minute - then I said so can I break the rules or amend it, because what I see is making sense but following the book is frustrating me lol...
I mean it got through to me through multiple accounts including personal and funded accounts - (side note I'm not rich) hopefully this helps to to understand how I spot moves.
As long as you journal then you have a chapter to start from and that 1!!!!!

How to Begin Trading in 6 Steps
If you have already taken the leap and started trading – You may skip this article and enjoy your day 😊
Beginner traders, I’m writing this for you!
Financial trading has never been more accessible, cheaper and innovative than ever before.
What you have available today, I once had to pay up to $10,000 a year. And some charting platforms cost up to $25,000 a year!
Absolutely insane.
And now today, it’s ready for you for practically FREE especially on TradingView!.
However, if you’re ready to to embark on this journey successfully, there are some essential components that you must have.
You’ll need 6 things to start your trading the right way.
1. Trading Platform
A trading platform is your gateway to the financial markets.
It’s an online software that allows you to execute trades, monitor markets, analyze price charts, and do much more.
The best platforms are user-friendly, offer a wide range of tools, and support multiple asset classes such as stocks, forex, insdices, commodities, and cryptocurrencies. They should also offer either spread betting, CFDs (which is what I like), futures and or lots.
Make sure the platform you choose is regulated by relevant financial authorities and offers strong security measures to safeguard your funds and data.
2. Charting Platform
A charting platform is a tool used to visualize market data.
You should be able to choose various formats such as line, bar, and candlestick charts.
They also provide a range of technical analysis indicators, such as moving averages, RSI, MACD, and Fibonacci retracements, which can help you analyze market trends and make informed trading decisions.
When you choose a charting platform, consider its ease of use, customizability, the range of available indicators, and compatibility with your trading platform.
3. Fund Your Account
Before you can start trading, you need to fund your trading account.
Now here’s the funny thing.
Most people put in like $1,000 or like $10,000 – Something ridiculously small.
And they just keep it at that. Look, you can have a sizeable account in your portfolio. And you can trade as if you have $1,000. You don’t need to trade everything.
But you do need to take that leap and deposit money into your account.
Also, understand the platform’s margin requirements to avoid potential margin calls (When they tell you – you have to cough up more money).
You need to be 100% ready and have your capital management prepared to a T.
4. Trading Strategy
This is your roadmap.
This is your ‘holy-grail’
This is your game plan.
This is your future plan in the financial markets.
You get the point.
A strategy will outline:
• How to know when a trade lines up.
• When to enter trades according to criteria
• When to exit a trade according to criteria.
• When to adjust your trade if need be (Lock in profits, cut losses, maximise gains).
• Which markets to trade
• How much to risk on each trade.
Your strategy can be based on technical analysis, fundamental analysis, or a combination of both.
I have used a 20 year old strategy that incorporates chart patterns, money management rules, two indicators and Smart Money Concepts.
More importantly, your strategy should align with your financial goals, risk tolerance, and trading schedule.
5. Trading Journal
A trading journal is a record of all your trades.
It includes entry and exit points, the reasons for taking the trade, the strategy used, and the outcome.
I also have other elements like Mistakes, Emotions, Drawdowns, Risk to reward and so many more.
Basically, it’s a valuable tool to reflect on your performance.
This will allow you to review your trades, learn from your mistakes, and improve your strategy over time.
6. Rules and Criteria
To ensure discipline and risk management in trading, it’s essential to set rules and criteria. These guidelines will help you remain consistent and prevent emotional decision-making. Here are some examples:
• Halt after a 15% drawdown on your account:
This rule can prevent further losses during a bad trading period.
It’s a form of risk management, forcing you to stop and reassess your strategy when things are not going as planned.
• Never risk more than 2% per trade:
This rule ensures that even multiple losing trades in a row won’t wipe out your account.
• Only trade with the trend:
When market is up – only look for longs.
When market is down – only look for shorts.
When market is sideways – Be cautiously
• Every trade needs a stop-loss and take-profit level
This automates risk management, ensuring you exit trades at predetermined levels.
• Limit the number of trades per day or period
This prevents overtrading. Always think quality versus quantity. And if you have a couple of trades, make sure you know what the WORST case scenario is for your portfolio if you hit a losing streak.
Sometimes it’s best to hedge positions (Longs and Shorts). and keeps you focused on quality rather than quantity.
• No trading during high-impact news events
Markets can be particularly volatile during these times, which can increase risk.
This is just a fraction of your journey.
Enjoy your trading journey.
It’s exciting.
It’s also long, be patient. This won’t take a month, a year or even three years.
But after 3 years, you’ll get a taste of the potential of trading fortunes.
But it’s all up to you!
This needs preparation, discipline, and constant learning.
You have the starting steps…
Now get to it.

📈Mastering Forex Trading: Your Ultimate Trade Checklist📉
✅Entering the forex market can be an exciting and potentially profitable endeavor. However, it requires careful planning and diligent decision-making to succeed. One essential tool to streamline your trading process is a trade checklist. In this article, we will guide you through the creation and effective use of a trade checklist, providing practical examples along the way.
📌Preparing for a Trade:
Before you pull the trigger on any trade, it's crucial to conduct thorough analysis and set clear objectives. Ensure your trade checklist includes the following elements:
▪️Identify the Market Trend: Determine the overall direction of the currency pair you wish to trade. Consider using various technical indicators, such as moving averages or trend lines, to confirm the trend.
▪️Define Entry and Exit Criteria: Set precise entry and exit points to minimize emotion-driven decisions. Identify key levels of support and resistance, and determine the minimum risk-to-reward ratio you deem acceptable.
📌 Risk Management:
A robust risk management strategy is fundamental to long-term success in forex trading. Incorporate the following risk management elements into your trade checklist:
▪️Determine Position Size: Calculate the appropriate position size based on your risk tolerance and account balance. Consider using tools such as position calculators or risk/reward ratio formulas.
▪️Set Stop Loss and Take Profit Levels: Define stop loss points to protect your capital from excessive losses and specify take profit levels to lock in profits once your target is reached.
📌Trade Execution:
Executing a trade swiftly and accurately is vital. Include the following checklist items to ensure consistent and disciplined execution:
▪️Double-check Parameters: Before placing a trade, review all the crucial parameters, including currency pairs, position size, entry and exit levels, and stop loss/take profit points.
▪️Timing Considerations: Be aware of upcoming economic releases, news events, or major market sessions that may impact your chosen currency pair, and adjust your trade execution timing accordingly.
💹Conclusion:
By incorporating a trade checklist into your forex trading routine, you can significantly enhance your decision-making process and overall trading performance. Remember to adapt your checklist to align with your personal trading style and preferences, continually evaluate its effectiveness, and make necessary improvements. Successful trading is a result of thorough planning, disciplined execution, and a continuous desire to learn and optimize your approach.
☺️I hope this post was helpful to some of our beginner traders😊
Dear followers, let me know, what topic interests you for new educational posts?

📈Golden Cross and Death Cross: Decoding Forex Trading Signals📉
✅When it comes to analyzing the Forex market, traders often rely on various indicators and patterns to make informed decisions. Two popular patterns that can provide valuable insights are the golden cross and death cross. In this article, we will explore what these terms mean, how they can be identified, and how traders can use them to their advantage.
✅Golden Cross:
The golden cross is a bullish signal that indicates a potential uptrend in the market. It occurs when the shorter-term moving average, typically the 50-day moving average, crosses above the longer-term moving average, usually the 200-day moving average. This crossover suggests that the price is gaining momentum and that buyers are becoming more active.
Traders often interpret the golden cross as a confirmation of a strong market sentiment, leading them to open long positions or increase their current holdings. It is seen as a positive sign as it suggests that a positive trend is likely to continue.
✅Death Cross:
On the other hand, the death cross is a bearish signal indicating a possible downtrend. It occurs when the shorter-term moving average crosses below the longer-term moving average. Similar to the golden cross, the death cross is typically identified using the 50-day and 200-day moving averages.
The death cross can be interpreted as a confirmation of a negative market sentiment with increased selling pressure. Traders may consider opening short positions or reducing their existing long positions in anticipation of a downward trend.
✅Using Golden Cross and Death Cross in Forex Trading:
While the golden cross and death cross patterns can provide valuable insights, traders should not solely rely on them for making trading decisions. It is important to consider other indicators, fundamental analysis, and overall market conditions.
🟢Confirmation: Traders should look for additional confirmation, such as increased trading volume or other technical indicators aligning with the signal, before entering a trade.
🟢Timeframes: Different timeframes (hourly, daily, weekly, etc.) can produce different crossing signals. Traders should select the timeframe that suits their trading strategy and goals.
🟢False Signals: It is crucial to acknowledge that golden cross and death cross signals are not foolproof. In certain market conditions, they may generate false signals, leading to incorrect trading decisions. Thus, it is advisable to use them in conjunction with other technical analysis tools.
✅The golden cross and death cross are popular patterns used in Forex trading to identify potential bullish and bearish market conditions, respectively. These signals provide traders with valuable information about market sentiment, allowing them to make more informed trading decisions. However, it is important to use these patterns in conjunction with other indicators and analyses to increase the probability of success. Remember, understanding these patterns is just the beginning of the trading journey – continuous learning and adaptation are key to becoming a successful trader.
I hope this post was helpful to some of our beginner traders😊
Dear followers, let me know, what topic interests you for new educational posts?

🐼Mastering the Art of Forex Trading Strategies🐼
Key words:
,,,,, , ,,
🐼The world of forex trading is as fascinating as it is dynamic. To thrive in this fast-paced market, developing a robust trading strategy is paramount. In this article, we will explore the key points that can help you identify and refine your trading strategy, bringing you closer to success.
🐼Identifying Market Trends:
Understanding market trends is crucial in making informed trading decisions. By analyzing moving averages, trend lines, and price patterns, you can identify the prevailing market direction and potential opportunities.
🐼Implementing Effective Risk Management Strategies:
Mitigating risks is a vital aspect of any trading strategy. Set appropriate stop-loss orders, determine suitable position sizes, and manage leverage wisely to protect your capital and minimize exposure to potential losses.
🐼Incorporating Technical Analysis Tools:
Technical analysis tools provide valuable insights into market behavior. Use oscillators like the Relative Strength Index (RSI) to identify overbought or oversold conditions, Fibonacci retracement levels to pinpoint support and resistance levels, and Bollinger Bands to gauge market volatility.
🐼Staying Informed about Market News and Economic Calendar Events:
Keeping up with the latest news and economic events can provide valuable context for your trading strategy. Monitor economic indicators such as GDP releases, central bank meetings, and geopolitical events to understand potential impacts on currency movements.
🐼Conclusion:
Crafting a successful forex trading strategy requires a comprehensive approach that covers market trend identification, risk management, technical analysis, and staying informed about market news. By incorporating these key points into your strategy, you can enhance your trading skills and increase your chances of long-term success in the forex market. Remember, forex trading is a continuous learning journey, so adapt and evolve your strategy as the market evolves.
Please cheer me up with a like and a nice comment😸❤️
Please, support my work with like and comment!
Love you, my dear followers!👩💻🌸

📉Mastering the Art of Control: Stop and Limit Orders Unveiled📈
📌In the thrilling world of forex trading, where fortunes rise and fall in the blink of an eye, having the ability to control your trades is paramount. Among the arsenal of tools at your disposal, stop and limit orders reign supreme. These magnificent creations empower traders to set their own boundaries and ensure that the roller coaster ride of forex trading remains under their command. So, buckle up and embark on this exciting journey of understanding stop and limit orders!
📌Understanding Stop Orders:
Stop orders are like steadfast guardians, appointed to protect your hard-earned profits or minimize potential losses. Imagine them as your personal bodyguards ready to leap into action at the first sign of trouble. When you place a stop order, you determine a specific price at which your trade should be closed automatically if the market moves against you. This mighty order helps you sidestep the risk of your entire trade being wiped out by sudden market swings or unexpected news events.
📌Shining a Light on Limit Orders:
Limit orders are akin to skillful negotiators, tirelessly working to secure the best possible price for your trades. Picture them as your savvy diplomats, taking charge of your trades and ensuring you reap maximum rewards. With a limit order, you specify a particular price at which you want to enter or exit the market. It’s like having an invisible hand that waits patiently until your desired price is met before executing your trade. This remarkable order empowers you to seize opportunities and helps lock in your well-deserved profits.
📌The Dance of Stop and Limit Orders:
Now that we understand each order's unique strengths, let's witness the masterful coordination between stop and limit orders, as they work together seamlessly to protect and maximize your forex trading outcomes. By using stop and limit orders in tandem, you can create a framework that balances risk and reward, empowering you to navigate the treacherous waters of the forex market.
📌Example Scenario:
Imagine you're trading EUR/USD, and you've just entered a long position at 1.2000. You're optimistic about the pair's potential, but you don't want your gains to vanish overnight. In this case, you place a stop order at 1.1950. This ensures that if the market takes a nosedive and reaches 1.1950, your trade will be automatically closed, safeguarding your hard-earned capital.
Simultaneously, you set a limit order at 1.2100, securing your target profit level. It's like having a guardian angel watching over your trade, ensuring that once your desired profit is reached, your trade is closed automatically, guaranteeing you a win.
📌Conclusion:
Stop and limit orders are the under-appreciated heroes of forex trading, granting you the power to control and protect your trades. With stop orders acting as your shield and limit orders as your sword, you can set your boundaries and seize opportunities with confidence. Harnessing the potential of these remarkable orders will elevate your trading game by ensuring you stay in charge, even when the markets are at their most unpredictable. So go forth, brave traders, and let your stop and limit orders pave the way to victory in the thrilling realm of forex trading!
I hope this post was helpful to some of our beginner traders😊
Dear followers, let me know, what topic interests you for new educational posts?

✅The DO’S And DON’TS Of Risk Management❌
❤️Risk management is a crucial component of forex trading to help minimize potential losses. In this article, we’ll explore the do’s and don’ts of risk management in forex trading.
🧡DO’S
💁🏼♀️Set a stop-loss order: A stop-loss order is a pre-set level at which a trade will automatically close, thus limiting the loss on an open position.
💁🏼♀️Diversify your portfolio: Spread your investments across multiple currency pairs to avoid exposure to a single currency’s risks.
💁🏼♀️Use leverage wisely: Leverage allows traders to invest more than their account balance. However, it also increases the potential risk. Only trade with leverage if you fully understand how it works.
💁🏼♀️Keep an eye on economic events: Economic events can impact forex markets. Keeping a close eye on them can help you adjust your trading strategy accordingly and avoid unexpected losses.
💁🏼♀️Use risk-reward ratio: It is essential to have a clear risk-reward ratio in mind before entering a trade. This ratio should be based on your established trading strategy and the probability of success.
💙DON’TS
🙅🏼♀️Don’t invest more than you can afford to lose: This is a fundamental rule of investing in any financial market. Never invest more than you can afford to lose.
🙅🏼♀️Don’t let emotions drive your trading: Emotions such as fear, greed, and hope can lead to impulsive decisions and cause significant losses.
🙅🏼♀️Don’t ignore fundamental analysis: Fundamental analysis helps traders understand a country’s economic and political situation, which can significantly impact forex markets.
🙅🏼♀️Don’t follow the herd: It is essential to have your own trading strategy and stick to it. Following others' trades blindly can lead to significant losses.
🙅🏼♀️Don’t trade without a strategy: A trading strategy helps you make informed decisions and minimize the risks of trading. Not having a strategy can lead to impulsive decisions and significant losses.
🖤 In conclusion , risk management is a crucial component of forex trading. It is essential to follow the do’s and don’ts mentioned above to minimize potential losses and make informed decisions. Remember, successful trading comes with experience, discipline, and patience. Happy trading!
Please cheer me up with a like and a nice comment😸❤️
Please, support my work with like and comment!
Love you, my dear followers!👩💻🌸

👻The Movers and Shakers: Meet the Big Forex Players👻
🍀The forex market is a dynamic and complex marketplace, with billions of dollars changing hands every day. At the center of this volatile financial landscape are a handful of key players who wield immense power and influence over the direction of global currencies. In this article, we'll introduce you to some of the biggest and most influential forex market players.
🌸The Central Banks: "We set the tone for the entire forex market."
Perhaps the most important forex market players are the world's central banks. These powerful institutions have the ability to control the supply and demand of their respective currencies, through interest rate policies and other monetary maneuvers. Whenever a central bank makes a move, traders around the world sit up and take notice.
🌺The Big Banks: "We are the gatekeepers of the forex market."
Big banks are another major group of forex market players, and they play a critical role in providing liquidity to the market itself. These institutions act as intermediaries, buying and selling currencies on behalf of their clients and helping to facilitate trades between different market players.
🌼Hedge Funds and Trading Firms: "We thrive on volatility and uncertainty."
Hedge funds and trading firms are a relatively new entrant to the forex market, but they have quickly become some of the most important players. These firms are often staffed by experienced traders and analysts who use complex algorithms and trading strategies to capitalize on short-term market movements.
🌹In conclusion, the forex market is a complex and ever-evolving landscape, but understanding the key players involved can help investors and traders make more informed decisions. Whether you're following the moves of central banks, working with big banks, or leveraging the insights of hedge funds and trading firms, the forex market is full of opportunities for those who are willing to take the risk.
Please cheer me up with a like and a nice comment😸❤️
Please, support my work with like and comment!
Love you, my dear followers!👩💻🌸

👻3 Steps To Become A Professional Trader👻
Becoming a professional trader is not an easy task. While trading may seem exciting and lucrative, it requires dedication, discipline, and a sound understanding of the markets. In this article, we’ll share with you three key steps to becoming a professional trader.
🌺Step 1: Build a Strong Foundation
Before beginning your journey as a trader, it’s essential to build a strong foundation. This involves educating yourself about the financial markets, including learning about different trading strategies, technical analysis, risk management, and market psychology. The good news is there are plenty of resources available online to learn about trading principles and strategies.
Another part of building a strong foundation involves studying the market and practicing with demo accounts. Demo accounts allow you to practice trading in a simulated environment that replicates the real market.
🌸Step 2: Develop a Trading Plan
Developing a trading plan iscrucial to becoming a successful trader. A trading plan should outline your objectives, risk management strategies, trading rules, and decisions about entry and exit points. It would help if you also identified what type of trader you are, whether that’s a day trader, swing trader, or a position trader.
A trading plan gives you a framework to base your trading decisions on, which can help you remain disciplined and make smart choices based on data, not emotions.
🌼Step 3: Consistency is Key
Consistency is key in trading. It’s not enough to have a single profitable trade; you need to be able to make profitable trades consistently. To achieve this, you need to have patience, discipline, and a strong mindset.
One of the essential aspects of consistency in trading is understanding and managing risk. This involves limiting potential losses and setting profit targets to ensure you don’t go overboard.
Lastly, you need to set realistic expectations and maintain good habits like keeping a trading journal, analyzing your trades, and continuously improving your trading strategies.
In conclusion, while there isn’t a specific recipe for success when it comes to trading, these three steps outline the fundamental elements of becoming a professional trader. With dedication, effort, and discipline, you too can make a living or even a fortune from trading!
Please cheer me up with a like and a nice comment😸❤️
Please, support my work with like and comment!
Love you, my dear followers!👩💻🌸

gbpjpy for another drop ?GBPJPY had big bullish energy last week for majority of the week. I can see a slight retest and then it heading down again.

✅TOP 5 BASIC RULES FOR FOREX MARKET BEGINNERS✅
⚜️Forex trading can be an intimidating venture for beginners, but don't let that scare you off! With the right mindset and a few basic rules, you can start trading confidently and profitably in no time. In this article, we'll go over five essential rules for forex market beginners that will help you navigate the trading world with ease.
⚜️Rule 1: Understand the Market
The first step to becoming a successful forex trader is to understand the market and how it works. Forex trading involves buying and selling currencies in the hopes of making a profit from the changes in their values. To get started, you'll want to learn about the different currencies, their values, and the factors that influence their prices. Some traders specialize in only a few currencies, while others prefer to take a broader approach.
⚜️Rule 2: Practice, Practice, Practice
Nobody becomes a great forex trader overnight, so it's important to practice your skills as much as possible. Some brokers offer demo accounts that allow you to trade with virtual currency in a simulated market. This is a great way to practice without risking real money. Use this time to develop your trading strategy, try out different indicators and techniques, and get comfortable with the platform you're using.
⚜️Rule 3: Manage Your Risk
When trading forex, it's important to manage your risk to avoid losing more money than you can afford. This includes setting stop-loss orders to limit your losses, trading with a smaller portion of your available capital, and avoiding risky trades that could lead to significant losses.
⚜️Rule 4: Keep Up with the News
Economic and political events can significantly impact currency values. For example, an increase in interest rates by a central bank can lead to an increase in the value of that country's currency. It's important to stay up-to-date with news and events that could influence the market. This will help you make well-informed trades and react quickly to changes in the market.
⚜️Rule 5: Be Patient
It's easy to get caught up in the excitement of forex trading, but remember that patience is key. Don't rush into trades without doing your research first, and don't let the fear of missing out (FOMO) push you to take unnecessary risks. Be patient and trust your strategy, and you'll see better results in the long run.
⚜️In conclusion, following these five basic rules can help any beginner forex trader get started on the right foot. Remember to take your time, practice often, and manage your risk to avoid significant losses. And most importantly, enjoy the thrill of trading, and have fun with it!
I Hope you guys learned something new today✅
Wish you all Best Of Luck👍
😇And may the odds be always in your favor😇
Do you like this post? Do you want more articles like that

Best investing advice to myself if the financial panic comesIve seen this movie before, and I love thats its playing again. The economy goes through cycles and its rhyming like other times. Its never the same, lets be clear about that. But expensive things get cheaper when the economy slows down because people will need their money for the hard times that may come. Its that simple.
Learning to read financial statements and metrics is like learning your ABCs but for investing. Trading off a chart is good, but learning what is behind the chart will help in uncertainty. "deep faith eliminates fear". The chart wont tell you if a company is losing money or if there are more assets than the marketcap is reflecting.
Buy decade growers for the best deal you can, and let them work. Best advice to myself. see you in 20 years.

GBPUSD FLY TO THE SKY!!GBPUSD is nearing Daily Trenline.. waiting for a possible breakout out and maybe a retest to confirm buy. Waiting patiently for move.

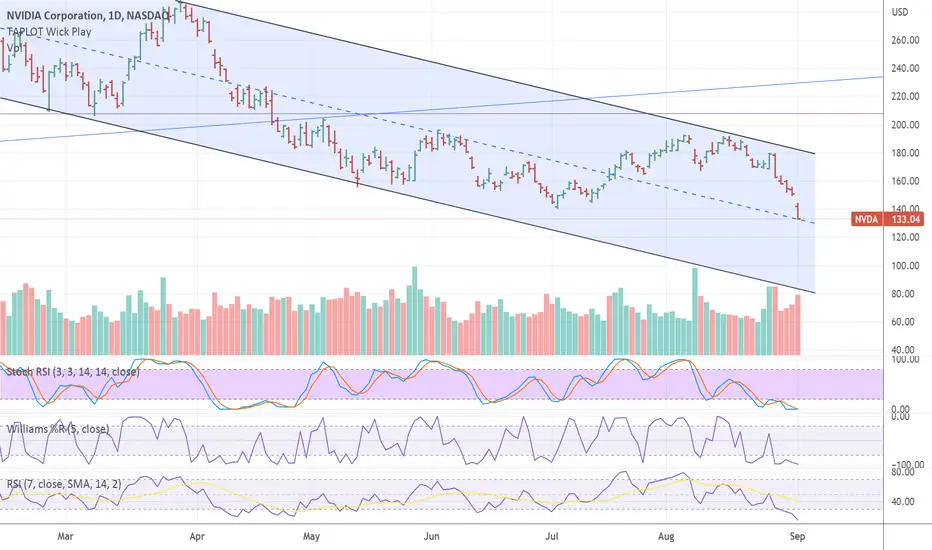
$NVDA downtrending channelWill $NVDA get support from dashed mid-line of down trending channel?
This dashed line was resistance before. $NVDA is a nice technical
chart to watch. Lots of professional engineers, who now trade, like to trade
$NVDA which makes it great for technical analysis.
A little something to help others beginners market is in a gully new retail traders are coming to trade let me tell you something important even if you know technical analysis that is not enough
what you need is a proper risk management rules and get rid of all your psychological issues I suggest that if want to become a trader first thing you
do is work on your psychology only books will not help you in that you need a mentor who will guide you in developing a system and help you understand
different types of market and help you make no mistake in executing your system lots of people have system but they do not trust there system and
because of that they lose money always have learning mindset it will help you because market trends always change

GMTUSDT PERPI'm looking to go bullish a little on market
I feel this might actually go well, looking good. The market is still bearish but we can still pick up short LONGs entry.

GBPJPY hits 2-1/2 week high as pound sterling recoversGBPJPY hits 2-1/2 weeks high on surging pound sterling. It gained sharply against USD on upbeat UK CPI data.
Technicals:
On the lower side, immediate support is around 162.80,
watched is around 164, a break above that level confirms intraday bullishness, and a jump to 166 is possible.
