BERAUSDT Major Breakout in Progress? Early Signal of a Potential📊 Full Technical Analysis
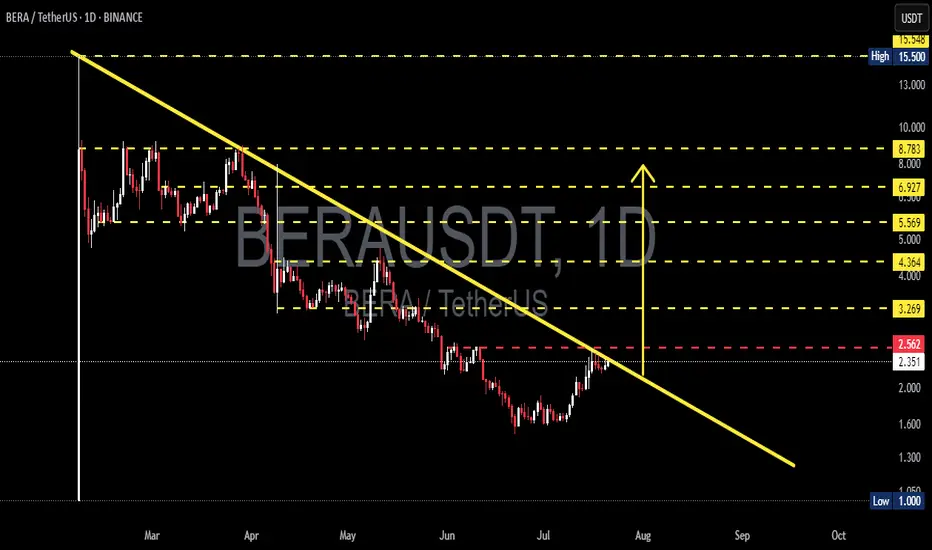
The BERA/USDT pair is displaying a highly compelling structure on the daily time frame, where the price has formed a Falling Wedge / Descending Triangle pattern over the past 4+ months.
This type of pattern often signals a large-scale accumulation phase by smart money, followed by an explosive breakout once selling pressure is exhausted and demand starts to dominate.
🧱 Pattern Structure: Falling Wedge / Descending Triangle
Descending trendline resistance (yellow line): Has suppressed price action since early March 2025
Horizontal support formed around the $1.00 to $2.00 zone (strong accumulation area)
Volume has been contracting — a typical sign of a wedge nearing breakout point
Price is approaching the key breakout zone at ~$2.56, showing early signs of reversal
---
✅ Bullish Scenario (Potential Major Reversal)
If the daily candle closes above $2.56 with strong volume confirmation, the breakout could trigger significant upside, with potential targets as follows:
Target Resistance Levels Notes
$3.269 Minor resistance + breakout confirmation level
$4.364 Previous support turned resistance
$5.569 Key historical distribution zone
$6.927 – $8.783 Mid-term targets / potential profit zones
$15.500 Long-term ATH target if momentum continues
💡 Additional Bullish Catalysts:
Volume compression aligns with classic breakout behavior
Breakouts from such macro patterns can yield 100–300% rallies in crypto markets
❌ Bearish Scenario (Rejection or Fakeout Risk)
If the price gets rejected at the trendline near $2.56 and fails to break above:
A pullback to the $2.00 – $2.35 support zone is likely
Further selling pressure may push price down to $1.00 (major support & psychological level)
A drop below $1.00 would confirm a continuation of the downtrend, forming new lower lows
🚨 Caution: Be wary of false breakouts — especially if the breakout happens with low volume or against bearish divergences.
🧠 Trading Plan & Strategy
Conservative Entry: Wait for a confirmed breakout + retest + volume confirmation
Aggressive Entry: Enter on daily candle close above $2.56
Stop Loss (SL): Below previous support: $2.30 or tighter at $2.00
Take Profit (TP): Scale out at $3.2 – $4.3 – $5.5 – $6.9 – $8.7
🧭 Conclusion: Critical Moment for a Macro Reversal?
> BERA is at a pivotal point that could define its next major trend. A successful breakout from this long-term pattern could mark the beginning of a powerful bullish cycle.
The technical setup is solid, the breakout level is near, and the reward-to-risk ratio is highly attractive — ideal for swing traders, breakout traders, and mid-term investors.
#BERA #BERAUSDT #CryptoBreakout #FallingWedgePattern #AltcoinAnalysis
#BreakoutSetup #TechnicalAnalysis #SwingTrade #CryptoSignals
#BullishReversal
Berausdtidea
BERAUSDT Bullish Wedge Breakout!BERAUSDT has been trading within a well-defined falling wedge pattern for the past several weeks, indicating a strong downtrend. However, recent price action shows a potential breakout from the upper trendline of the wedge, which could signal a bullish reversal.
Breakout Alert: Price has broken above the wedge resistance with strong bullish momentum.
EMA Confirmation: Price is pushing above the 50 and 100 EMAs, supporting a potential trend shift.

BERAUSDT 12H Analysis BERA ~ 12H Analysis
#BERA This coin has a strong bullish trend. Buy from here with a short-term target of at least 10%+

Breaking: Berachain Coin ($BERA) Breaks Critical Support LevelBerachain's native coin ( BIST:BERA ) underwent a "Break of Structure" (BOS) cracking through the critical support level dipping 15% today.
It is worth noting that the EVM-identical Layer 1 blockchain that introduces Proof of Liquidity (PoL), a novel consensus mechanism aligning network security with liquidity provision has consecutively dip every week placing the asset on the cusp of reaching its 1-month low as hinted by the RSI at 21.
BIST:BERA is deeply oversold, it will need the general market to revived for BIST:BERA to make a comeback. With CRYPTOCAP:BTC faking the $80k support, most assets are in a state of respite as most of them assets mirror CRYPTOCAP:BTC 's price action.
The grit on BIST:BERA is high, the support point has already being broken. In order for BIST:BERA to make a comeback, it has to break above the 61.8% Fibonacci level which is a point that aligns with the $5- $6 price points.
Berachain Price Live Data
The Berachain price today is $3.66 USD with a 24-hour trading volume of $193,816,088 USD. Berachain is down 14.32% in the last 24 hours. The current CoinMarketCap ranking is #108, with a live market cap of $393,434,029 USD. It has a circulating supply of 107,480,000 BERA coins and the max. supply is not available.

Breaking: $BERA coin Dips 14% Today The price of BIST:BERA coin saw a 14% nosedived today amidst general crypto and stock market bloodbath that saw over $2.85 trillion wiped out from the US stock market today.
All this irregularities came as result of Donald Trump's Tax Tariff rates on Crypto currencies and stock shares.
For BIST:BERA , the RSI already hints at a weaker trend channel but BIST:BERA is bouncing off of the 78.6% Fibonacci retracement level that is acting as a support point for $BERA. However, should extreme selling pressure emerge, the 1-month low s will be force to act as support point for $BERA.
About Berachain
Berachain is an EVM-identical Layer 1 blockchain that introduces Proof of Liquidity (PoL), a novel consensus mechanism aligning network security with liquidity provision. The protocol operates on a unique two-token model: BERA (gas and staking token) and BGT (non-transferable governance and rewards token).
Berachain Price Live Data
The live Berachain price today is $5.93 USD with a 24-hour trading volume of $175,431,304 USD. Berachain is down 16.38% in the last 24 hours, with a live market cap of $637,052,141 USD. It has a circulating supply of 107,480,000 BERA coins and the max. supply is not available.

Breaking: $BERA Surge 13% Amidst Breaking Out Of A Falling WedgeBerachain's native token ( BIST:BERA ) saw its price rise nearly 15% today after breaking out of a falling wedge pattern albeit CRYPTOCAP:BTC is still consolidating.
Berachain is an EVM-identical Layer 1 blockchain that introduces Proof of Liquidity (PoL), a novel consensus mechanism aligning network security with liquidity provision. The protocol operates on a unique two-token model: BERA (gas and staking token) and BGT (non-transferable governance and rewards token).
As of the time of writing, BIST:BERA coin is up 10.72% trading within a bullish engulfing pattern, the asset's momentum is gearing up for another legged up with a 49% surge in sight as hinted by the RSI at 69.66.
Further adding to this bullish thesis, data from Defilama shows about $3.49 Billion is locked in Total Value Lock (TVL) in the Berachain ecosystem this is for a project that is barely 2 months from debut but data shows growing interest in the ecosystem.
Berachain Price Live Data
The live Berachain price today is $8.57 USD with a 24-hour trading volume of $222,650,821 USD. Berachain is up 12.20% in the last 24 hours, with a live market cap of $920,747,642 USD. It has a circulating supply of 107,480,000 BERA coins and the max. supply is not available.

#BERAUSDT shows bullish momentum 📈 Long BYBIT:BERAUSDT.P from $8.080
🛡 Stop loss $7.905
🕒 1H Timeframe
⚡️ Overview:
➡️ The main POC (Point of Control) is at 6.699, indicating the area of highest volume accumulation.
➡️ The 7.905 level acts as the nearest support zone and is a key stop-loss reference point.
➡️ The chart BYBIT:BERAUSDT.P shows a strong bullish breakout with consolidation above previous range, signaling a possible trend continuation.
➡️ Rising volume confirms strength behind the move.
🎯 TP Targets:
💎 TP 1: $8.204
💎 TP 2: $8.320
💎 TP 3: $8.430
📢 Watch key levels closely — better to enter after signal confirmation!
📢 If the price holds above $8.080, the TP targets are likely to be hit.
📢 If stop level is breached, the setup may need reevaluation.
BYBIT:BERAUSDT.P shows bullish momentum — looking for further upside!

BERAUSDT 4HBERA ~ 4H Analysis
#BERA Pay attention to this charts. Wait for one of this line to be successfully penetrated.

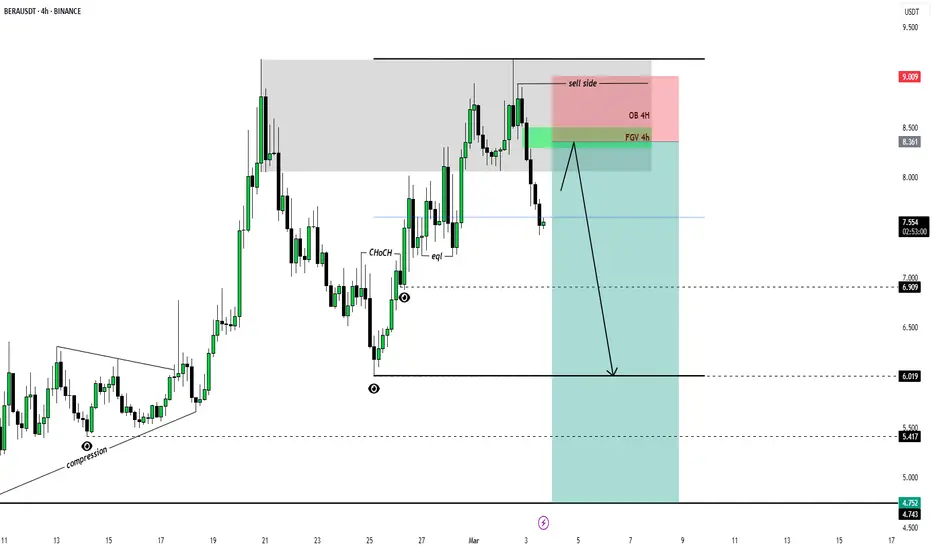
BERAUSDT SHORT 4H Based on the obtained market variables , most likely the BERA coin will continue its downward movement towards the designated targets on the chart.
I want to wait for the local price return in blocks OB 4H and FGV 4H to search for potential entry points. If the reaction is positive and the 15th TF is confirmed, I will apply a short position as indicated on the trading chart.
Targets:
$6,909
$6,019
$5.417
$4.752
Risk management - 1% on stop order