BERGEPAINT at Best Support !!This is the Daily Chart of BERGEPAINT .
BERGEPAINT having good law of polarity at 540-545 range.
EMA is also providing support for the stock around the 545 range.
If this level is sustain the , We may see higher price in BERGEPAINT.
Thank You !!
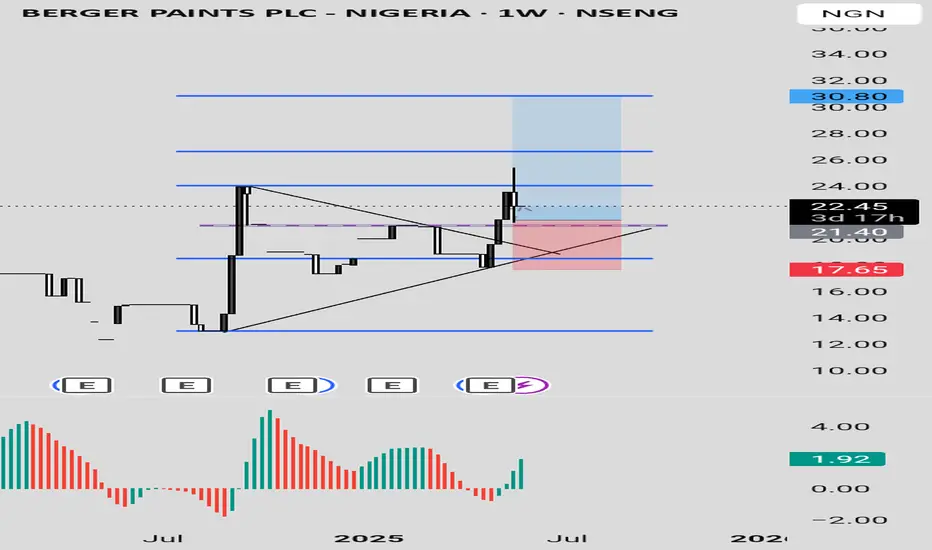
Bergerpaints

Berger Paints PLC Berger Paints PLC stock is showing a bullish signal for appreciating in value. The price dropped into a discount level and broke a down trend line with a strong bullish candle, closing above the trendline. This happened when the price was also in an oversold region as indicated by Awesome Oscillator.
Currently, there has been a pull back with a rejection, showing more confidence in the bullish move. The stock can be bought at the current price while targeting 24, 26.60 and 30.80 as the final target based on the Fibonacci level.
Confluences for the long signal:
1. Price is coming from a discount level
2. Price was in oversold level before and it is showing more bullish signal
3. Price had broken out of a down trend line with a strong bullish candle
4. There was a strong rejection from last week candle.
Disclaimer: this is not a financial advice. The outcome maybe different from the projection. Don't take the signal if you don't accept the risk.
Berger Paints at Make-or-Break Point:Descending Triangle PatternBerger Paints is currently testing the upper boundary of a long-term Descending Triangle on the weekly chart — a pattern known for sharp breakouts or breakdowns.
📊 Resistance Zone: 600 – A breakout above this level could trigger a powerful upside rally towards 825+, supported by the pattern's height projection.
🔻 Support Level: 543 – A breakdown below this level may lead to a sharp fall towards 400 levels.
⚠️ Bearish Pin Bar Candle at resistance signals caution; confirmation is key before entering any trade.
📌 Watch closely for a decisive move – this zone is critical for trend reversal or continuation.
This setup offers a high-reward opportunity for positional traders, with clear entry and exit zones. Manage your risk wisely and follow with volume confirmation.

HL Confirmed on Weekly.HL Confirmed on Weekly TF around 92.
Bullish Divergence on Daily TF.
Crossing 107 with Good Volumes
may lead it towards 112 & then 120+

BERGEPAINT good to studyNSE:BERGEPAINT
Given Breakout of Range
Good to keep on the radar
Always respect SL & position sizing
========================
Trade Secrets By Pratik
========================
Disclaimer
NOT SEBI REGISTERED
This is our personal view and this analysis
is only for educational purposes
Please consult your advisor before
investing or trading
You are solely responsible for any decisions
you take on basis of our research.

BERGEPAINT : Going LongThe current net holding is approximately 1.875% of the net capital. I plan to increase the holding to 2.5% once the price reaches the channel's lower trendline.
📢📢📢 If my perspective changes or if I gather additional fundamental data that influences my views, I will provide updates accordingly.
Thank you for following along with this journey, and I remain committed to sharing insights and updates as my trading strategy evolves. As always, please feel free to reach out with any questions or comments.
Other posts related to this particular position and scrip, if any, will be attached underneath. Do check those out too.
Disclaimer: The analysis shared here is for informational purposes only and should not be considered as financial advice. Trading in all markets carries inherent risks, and past performance is not indicative of future results. It's essential to conduct your own research and assess your risk tolerance before making any investment decisions. The views expressed in this analysis are solely mine. It's important to note that I am not a SEBI registered analyst, so the analysis provided does not constitute formal investment advice under SEBI regulations.

Buy Berger PaintsBerger Paints is the second largest paint company of India and a trusted brand in the market. It has given its best quarterly results and still the company is almost 27% down from its lifetime high. It is a good time to invest in the company. The company has reduced debt. The company has been maintaining a healthy dividend payout of 35.8%.
Please do your own analysis before investing.
Hope you learned something new from my ideas.
Do like, share and follow me. thank you!

BERGEPAINT NSE:BERGEPAINT
One Can Enter Now !
Or Wait for Retest of the Trendline (BO) !
Or wait For better R:R ratio !
Note :
1.One Can Go long with a Strict SL below the Trendline or Swing Low.
2. R:R ratio should be 1 :2 minimum
3. Plan as per your RISK appetite and Money Management.
Disclaimer : You are responsible for your Profits and loss, Shared for Educational purpose

BERGER PAINTSBerger Paint soon might come above 200 dema.
once above 200 dema and a major resistance, it can give a good rally .
as diwali is coming paint stocks have good reversal chances.
Disclaimer: only for education purposes, no buy or sell recommendation. we are not sebi registered. always discuss first with your financial advisors

Time to accumulate Berger paintsLooks like bottom is in for this share. Safe till it respects the stop loss.

MACD Crossover Swing Trade📊 Script: NESTLEIND
📊 Nifty50 Stock: YES
📊 Sector: FMCG
📊 Industry: Food - Processing - MNC
⏱️ C.M.P 📑💰- 2622
🟢 Target 🎯🏆 - 2769
⚠️ Stoploss ☠️🚫 - 2560
📊 Script: ADANIPORTS
📊 Nifty50 Stock: YES
📊 Sector: Marine Port & Services
📊 Industry: Miscellaneous
⏱️ C.M.P 📑💰- 1341
🟢 Target 🎯🏆 - 1426
⚠️ Stoploss ☠️🚫 - 1293
📊 Script: HEROMOTOCO
📊 Nifty50 Stock: YES
📊 Sector: Automobile
📊 Industry: Automobiles - Motorcycles / Mopeds
⏱️ C.M.P 📑💰- 4722
🟢 Target 🎯🏆 - 4949
⚠️ Stoploss ☠️🚫 - 4597
📊 Script: AMBUJACEM
📊 Nifty50 Stock: NO
📊 Sector: Cement
📊 Industry: Cement - North India
⏱️ C.M.P 📑💰- 612
🟢 Target 🎯🏆 - 650
⚠️ Stoploss ☠️🚫 - 592
📊 Script: BERGEPAINT
📊 Nifty50 Stock: NO
📊 Sector: Paints/Varnish
📊 Industry: Paints / Varnishes
⏱️ C.M.P 📑💰- 573
🟢 Target 🎯🏆 - 603
⚠️ Stoploss ☠️🚫 - 558
⚠️ Important: Always maintain your Risk & Reward Ratio.
✅Like and follow to never miss a new idea!✅
Disclaimer: I am not SEBI Registered Advisor. My posts are purely for training and educational purposes.
Eat🍜 Sleep😴 TradingView📈 Repeat 🔁
Happy learning with trading. Cheers!🥂

Berger paints to continue on the red streak!The stock seems to have fallen in an bearish impulsive wave between Sep-Oct 2023.
After this very fall the stock was in a complex triple three correction for almost 3 months.
The impulsive fall has been labeled as wave "A" and the stock has already begun the Wave "B" fall in the month of Jan.2024.
Wave "B" is projected going towards the INR 480 area.
580 will stand as a crucial resistance for the stock on the upside.

BERGEPAINT NEAR SUPPORTNear support zone.
Long term target 680
Disclaimer : This is not a Buy or Sell recommendation. Please consult your financial advisor before making any investments . This is for Educational purpose only

BERGEPAINTNSE:BERGEPAINT
One Can Enter Now ! Or Wait for Retest of the Trendline (BO) Or wait For better R:R ratio
Note :
1.One Can Go long with a Strict SL below the Trendline or Swing Low of Daily Candle.
2. Close, should be good and Clean.
3. R:R ratio should be 1 :2 minimum
4. Plan as per your RISK appetite
Disclaimer : You are responsible for your Profits and loss, Shared for Educational purpose

BERGERPAINTS TRENDLINE BREAKOUT!!!!The price following descending trendline resistance from a very long time. Whenever the price reaches near the trendline price taking resistance and slopes down. Now finally price breaks the trendline and closes above the trendline with good breakout candle. The level of 550 is strong support for the price . Candle closes above the breakout level of 575 and holding itself at the higher levels. price showing good momentum for swing reversal . After the breakout possible targets are 615--633 & 650.
BERGERPAINTS📊
👉🏻Range + Trendline Breakout
👉🏻Support 572 & 548
👉🏻Add for swing reversal
👉🏻Target possible 615/633/650+


Soon On Moon 🚀🔥🔥🥳🥳Breaks Trendline ... And also make W pattern and also retest the resistance... So go for it .. Now 🔥🔥🚀🚀🥳🥳👍🏻👍🏻

Missed actual entry and how it dropped while giving the confirmaMissed actual entry and how it dropped while giving the confirmation breaking the range and the with an entry at freshly created supply zone

BERGER PAINTBerger paint is at a very important support zone.
Good to buy this if a reversal is seen from this point.
Trade safe. Manage risk. Be profitable.
Please follow us for more simple trading analysis and setups. Also, let me know in the comment if you have any queries.
Disclaimer:- This is my view. Please analyze the charts yourself and then decide to take any trades.

A bearish pennant on the continuation of the fall. Updating lowsThe coin after the impulse decline formed a pattern triangle, or bearish pennant - a figure of continuation of the trend. The volumes inside the figure are reduced. I expect the price to approach the lower boundary of the triangle and the impulse breakout in the downward direction with the support of volumes in the seller's order book. The goal is the height of the base of the triangle.

Positional Up side view on BERGERPAINTAs per my analysis, NSE:BERGEPAINT is consolidating to move upper side.
My best entry level is 587 with stop loss of 563, and hold positionally till targets of 621 & 665.
Note: This is my personal analysis, only for learning.
Thanks.

Short Term Bullish Berger PaintsBerger Paints made a breakout and retest on the daily TF line chart.
Earnings on Nov 10th, 2022.
Pre ER run possible in this script.
Watchout for atleast 40-50rs move.
CMP is 604.

PAINT STOCK ANALYSISAt this time many people ask why asian paint, berger paint company breackdown, what is the reasion, why crude price and paint stock move same.
This is not happen only indian market but also word top paint company move same parrten,
