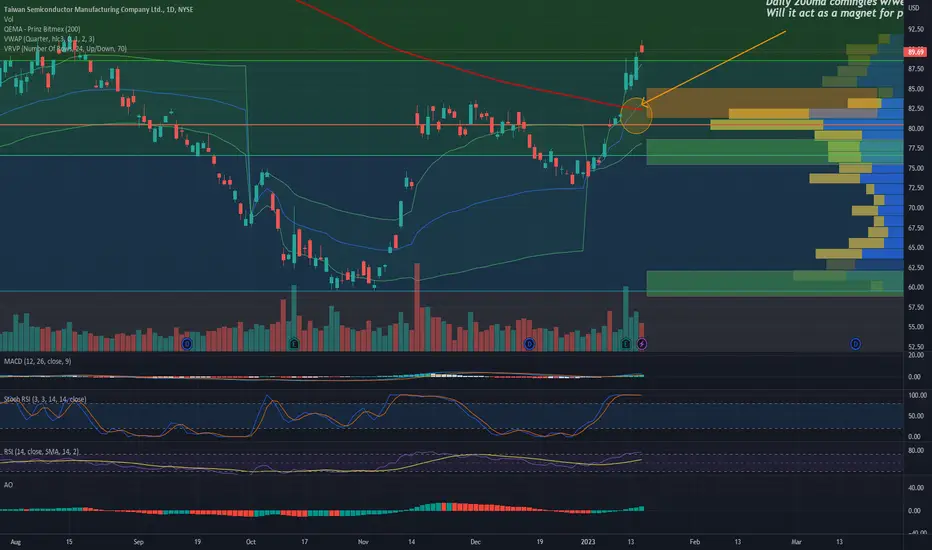
Could Buffet Get Mollywopped? TSM to drop? Keep an eye on semi-conductors in general and another eye on ES, SPY, etc. We have the 200ma and weekly vwap on daily time frame coming together. We also have momentum to the downside, sellers seem to have control. Not financial advice, DYOR.
#berkshirehathaway #warrenbuffet
Berkshirehathaway
BRK.A #RUGPULL?Stalling on weekly resistance.
Next stop 320k after retest of quarterly support at 408k?
NYSE:BRK.A

Buying Berkshire's break higher.Berkshire Hathaway B - 30d expiry - We look to Buy a break of 321.11 (stop at 312.39)
Daily signals are mildly bullish.
Short term momentum is bullish.
There is no clear indication that the upward move is coming to an end.
A break of the recent high at 320.50 should result in a further move higher.
This is curremtly an actively traded stock.
Our profit targets will be 342.8 and 348.8
Resistance: 320.50 / 330.00 / 340.00
Support: 314.00 / 305.00 / 297.00
Please be advised that the information presented on TradingView is provided to Vantage (‘Vantage Global Limited’, ‘we’) by a third-party provider (‘Signal Centre’). Please be reminded that you are solely responsible for the trading decisions on your account. There is a very high degree of risk involved in trading. Any information and/or content is intended entirely for research, educational and informational purposes only and does not constitute investment or consultation advice or investment strategy. The information is not tailored to the investment needs of any specific person and therefore does not involve a consideration of any of the investment objectives, financial situation or needs of any viewer that may receive it. Kindly also note that past performance is not a reliable indicator of future results. Actual results may differ materially from those anticipated in forward-looking or past performance statements. We assume no liability as to the accuracy or completeness of any of the information and/or content provided herein and the Company cannot be held responsible for any omission, mistake nor for any loss or damage including without limitation to any loss of profit which may arise from reliance on any information supplied by Signal Centre.

BERKSHIRE HATHAWAY repeating the post COVID recovery!Berkshire Hathaway Inc. (BRK.A) made a new ~5 month High yesterday, spearheading the bullish reversal of high cap stocks at the moment. The price is above the 1D MA200 (orange trend-line) and well above the 1D MA100 (green trend-line) and 1D MA50 (blue trend-line), the latter two are about to make a Bullish Cross.
This draws comparisons with the previous 'Strong correction' Phase, during the COVID outbreak in February - March 2020. As you see the stock dropped a little over -30%, with the 1D MA50/100 Bearish Cross signaling the last flush, the 1D Death Cross signaling the Bottom and the 1D MA50/100 Bullish Cross the confirmation of the new rally.
This time during the 2022 correction phase, the stock dropped a little less than -30%, again the 1D MA50/100 Bearish Cross signaled the last flush, the 1D Death Cross signaled the Bottom and the 1D MA50/100 Bullish Cross is very close to take place. Will it confirm a new rally. That remains to be seen. What's certain is the fact that this time, Berkshire is already above the 1D MA200, without having the 1D MA50/100 Bullish Cross, but it is just below the 0.618 Fibonacci retracement level, which was also a Resistance before the Cross.
We've plotted the 2020 correction and recovery phase on the 2022 price action (black line) and as you see, even though lengthened, it matches the trend almost perfectly. This points to a longer term recovery this time (reasonable in the absence of the 2020 trillions USD in rescue packages) but it does show an ATH test by Q3 2023.
-------------------------------------------------------------------------------
** Please LIKE 👍, SUBSCRIBE ✅, SHARE 🙌 and COMMENT ✍ if you enjoy this idea! Also share your ideas and charts in the comments section below! This is best way to keep it relevant, support me, keep the content here free and allow the idea to reach as many people as possible. **
-------------------------------------------------------------------------------
You may also TELL ME 🙋♀️🙋♂️ in the comments section which symbol you want me to analyze next and on which time-frame. The one with the most posts will be published tomorrow! 👏🎁
-------------------------------------------------------------------------------
👇 👇 👇 👇 👇 👇
💸💸💸💸💸💸
👇 👇 👇 👇 👇 👇

Price is what you pay, but value is what you getWarren Buffett is the most successful stock investor in the history of the world. Of course, which we know now. "The Oracle of Omaha" - that's what fans of his "magical instinct" call Buffett. But is that the point?
As an 11-year-old child, little Warren was inspired by the possibilities of the stock market and invited his sister to participate in his first investment. These were preferred shares of Cities Service. The sister agreed to take the risk and Warren bought 3 shares at $38.25. But then, the wave of enthusiasm turned to disappointment and guilt - the shares fell to $27. Buffett's first investment "enterprise" lost 29% of the amount of investments that were borrowed. We can only imagine how the young investor felt at that moment, but I think this feeling is familiar to many: positive expectations clashed with the harsh reality of the stock market. Warren didn't sell shares. But when the price for them reached $40, he did it instantly. Apparently, considering this whole undertaking a mistake. The income was 4.6%, the sister received her money back. Everything worked out. Surprisingly, Cities Service's share price rose to $202 a few days later. Or +428%, Warren!
The entire subsequent history of Warren Buffett confirms that he drew the right conclusions from the experience of his childhood. He realized that the price on the stock exchange may not reflect the value of the company itself. Buffett began to study accounting, the principles of fundamental analysis of enterprises, the ideas of Benjamin Graham. This allowed him to develop an approach that consisted in determining the real value of the company, different from the one that we see on the stock exchange.
"Price is what you pay, but value is what you get".
From myself I will add: and if the value is higher than the price - such an investment is considered reasonable.
In the chart above, the price history of Buffett's main holding company, Berkshire Hathaway . As well as the S&P500 index. As you can see, his company "overtakes" the index, which means it shows much better performance than the average value of 500 US companies.
Perhaps, in addition to deep analysis of the companies' business, Buffett's unique investor instinct helps, I don't know. But the fact that he is a real Wizard of our time is an indisputable fact for me.

BRK.B: Resistance cluster ahead!Berkshire Hathaway B
Intraday - We look to Sell at 311.03 (stop at 321.83)
Sentiment remains negative despite the pull-back higher in prices. Resistance is located at 311.00 and should cap gains to this area. Resistance could prove difficult to breakdown. Preferred trade is to sell into rallies.
Our profit targets will be 283.95 and 270.00
Resistance: 311.00 / 340.00 / 360.00
Support: 280.00 / 260.00 / 240.00
Please be advised that the information presented on TradingView is provided to Vantage (‘Vantage Global Limited’, ‘we’) by a third-party provider (‘Signal Centre’). Please be reminded that you are solely responsible for the trading decisions on your account. There is a very high degree of risk involved in trading. Any information and/or content is intended entirely for research, educational and informational purposes only and does not constitute investment or consultation advice or investment strategy. The information is not tailored to the investment needs of any specific person and therefore does not involve a consideration of any of the investment objectives, financial situation or needs of any viewer that may receive it. Kindly also note that past performance is not a reliable indicator of future results. Actual results may differ materially from those anticipated in forward-looking or past performance statements. We assume no liability as to the accuracy or completeness of any of the information and/or content provided herein and the Company cannot be held responsible for any omission, mistake nor for any loss or damage including without limitation to any loss of profit which may arise from reliance on any information supplied by Signal Centre.

10/30/22 BRKB Berkshire Hathaway Inc. New ( NYSE:BRK.B )
Sector: Finance (Multi-Line Insurance )
Market Capitalization: 667.191B
Current Price: $299.63
Breakout price: $302.20 (hold above)
Buy Zone (Top/Bottom Range): $294.45-$276.00
Price Target: $321.80-$325.80
Estimated Duration to Target: 56-62d
Contract of Interest: $BRKB 1/20/23 300c
Trade price as of publish date: $14.80/contract

Berkshire short positionBerkshire short position
Entry level: $289.28
Take profit: $276.03
Stop loss: $295.03

Buying a Berkshire break higher.BRK.B - 30d expiry - We look to Buy a
break of 283.03 (stop at 274.88)
The primary trend remains bullish.
Bullish divergence can be seen on the weekly chart (the chart makes a lower low while the oscillator makes a higher low), often a signal of exhausted bearish momentum, or at least a correction higher.
282.50 has been pivotal.
A break of 283 is needed to confirm follow through bullish momentum.
Prices have reacted from 260.
Our profit targets will be 304.97 and 309.97
Resistance: 280 / 290 / 300
Support: 270 / 265 / 260
Disclaimer – Saxo Bank Group.
Please be reminded – you alone are responsible for your trading – both gains and losses. There is a very high degree of risk involved in trading. The technical analysis , like any and all indicators, strategies, columns, articles and other features accessible on/though this site (including those from Signal Centre) are for informational purposes only and should not be construed as investment advice by you. Such technical analysis are believed to be obtained from sources believed to be reliable, but not warrant their respective completeness or accuracy, or warrant any results from the use of the information. Your use of the technical analysis , as would also your use of any and all mentioned indicators, strategies, columns, articles and all other features, is entirely at your own risk and it is your sole responsibility to evaluate the accuracy, completeness and usefulness (including suitability) of the information. You should assess the risk of any trade with your financial adviser and make your own independent decision(s) regarding any tradable products which may be the subject matter of the technical analysis or any of the said indicators, strategies, columns, articles and all other features.
Please also be reminded that if despite the above, any of the said technical analysis (or any of the said indicators, strategies, columns, articles and other features accessible on/through this site) is found to be advisory or a recommendation; and not merely informational in nature, the same is in any event provided with the intention of being for general circulation and availability only. As such it is not intended to and does not form part of any offer or recommendation directed at you specifically, or have any regard to the investment objectives, financial situation or needs of yourself or any other specific person. Before committing to a trade or investment therefore, please seek advice from a financial or other professional adviser regarding the suitability of the product for you and (where available) read the relevant product offer/description documents, including the risk disclosures. If you do not wish to seek such financial advice, please still exercise your mind and consider carefully whether the product is suitable for you because you alone remain responsible for your trading – both gains and losses.

Can one go wrong by buying Berkshire dips?BRK.B - Intraday - We look to Buy at 272.02 (stop at 264.98)
Support is located at 272.00 and should stem dips to this area.
Preferred trade is to buy on dips.
Weekly pivot is at 270.73.
Daily pivot is at 271.36.
We look for a temporary move lower.
Our profit targets will be 291.98 and 296.98
Resistance: 283.00 / 290.00 / 295.00
Support: 275.00 / 270.00 / 263.70
Weekly chart for context
Disclaimer – Saxo Bank Group. Please be reminded – you alone are responsible for your trading – both gains and losses.
There is a very high degree of risk involved in trading. The technical analysis , like any and all indicators, strategies, columns, articles and other features accessible on/though this site (including those from Signal Centre) are for informational purposes only and should not be construed as investment advice by you. Such technical analysis are believed to be obtained from sources believed to be reliable, but not warrant their respective completeness or accuracy, or warrant any results from the use of the information. Your use of the technical analysis , as would also your use of any and all mentioned indicators, strategies, columns, articles and all other features, is entirely at your own risk and it is your sole responsibility to evaluate the accuracy, completeness and usefulness (including suitability) of the information. You should assess the risk of any trade with your financial adviser and make your own independent decision(s) regarding any tradable products which may be the subject matter of the technical analysis or any of the said indicators, strategies, columns, articles and all other features.
Please also be reminded that if despite the above, any of the said technical analysis (or any of the said indicators, strategies, columns, articles and other features accessible on/through this site) is found to be advisory or a recommendation; and not merely informational in nature, the same is in any event provided with the intention of being for general circulation and availability only. As such it is not intended to and does not form part of any offer or recommendation directed at you specifically, or have any regard to the investment objectives, financial situation or needs of yourself or any other specific person. Before committing to a trade or investment therefore, please seek advice from a financial or other professional adviser regarding the suitability of the product for you and (where available) read the relevant product offer/description documents, including the risk disclosures. If you do not wish to seek such financial advice, please still exercise your mind and consider carefully whether the product is suitable for you because you alone remain responsible for your trading – both gains and losses.

OXYBuffett's ongoing purchase of large volumes of OXY, as well as buyouts by the Bill & Melinda Gates Foundation should lead to the growth of the paper, which is still quite attractive in terms of financial performance.


Berkshire Hathaway - Potential 20% Upside?Is the most famous investor in the modern history and his international conglomerate able to update historic highs before US economy spirals into recession?
Let's look at it in more detail.
Fundamental indicators:
Revenue and Profits - demonstrated consistent long-term earnings growth over the past 10 years except 2020
Profit margin - not consistent and varies from 10% to 20%, 2021 was with the highest 28%
P/E - 8.4x which is considerably lower than the current S&P500 ratio
Liabilities - no problems with debt
Technical Analysis (Elliott Waves):
Following the correction of March 2020 shares of Berkshire Hathaway have enjoyed similar growth cycle as S&P500 with 120% gains
This bull run was formed by an impulse where waves 1 to 4 have been completed and wave 5 is currently developing
Wave 4 is clearly identifiable as a lengthy and flat Running Correction that lasted between May and November 2021
The final wave of the impulse is quite choppy with lots of crossings which often indicates the development of an Ending Diagonal pattern with a structure of 3-3-3-3-3
If this is the case then waves 1 to 3 have been established and wave 4 is in the process of completion
Once this zigzag-like correction is over we can observe another zigzag to update the historic highs and potential gains for investors of 20%
What do you think about Berkshire Hathaway and its short term prospects?
Also let me know if you would like to see other stocks, indices, Forex or Crypto analysed using Elliott Waves.
Thanks

Berkshire Hathaway Inc. ShortBerkshire Hathaway had last pump in weekly uptrend. Now if price turns back to last consolidation it will be signal for sell. Potential support is $208.8

Berkshire Hathaway Prediction Here is a prediction of BRK.B in NYSE...
I'm sure Warren Buffet will not see my analysis :) But if my analysis be correct, I'm ready to cooperate with him =))

STNE backed by Buffett, names executive from JPMorgan ChaseSTNE StoneCo is a Brazilian payment-technology firm backed by Warren Buffett’s Berkshire Hathaway.
STNE is down 90% from the peak they hit in February 2021.
After another earnings miss, StoneCo named new senior managers one of them being the head of treasury, Diego Salgado, a former JPMorgan Chase & Co. director for Latin America debt capital markets.
My take profit area is between 15.60 and 19 usd.

Warren Buffett likes 50% RetracementsI was researching the holdings of AMEX:XLF to prepare for Sector Rotation into Financial which I think is due shortly and the top holding in that ETF is NYSE:BRK.B . While analyzing the chart I find that there were two distinct opportunities at major 50% Retracement Levels on 1/24/2022 and 2/24/2022. These are quite excellent holds of my key principle levels and a testament to the versatility of this one simple analysis.

Berkshire Hathaway B: Previous support provides good risk/rewardBerkshire Hathaway B - Short Term - We look to Buy at 275.30 (stop at 268.50)
We look to buy dips. We are trading within a Bullish Ascending Triangle formation. Previous support located at 275.00. The primary trend remains bullish. We look for a temporary move lower. The bias is still for higher levels and we look for any dips to be limited. Further upside is expected although we prefer to set longs at our bespoke support levels at 275.00, resulting in improved risk/reward.
Our profit targets will be 293.50 and 296.50
Resistance: 288.70 / 293.50 / 300.00
Support: 275.00 / 271.00 / 247.00
Disclaimer – Saxo Bank Group. Please be reminded – you alone are responsible for your trading – both gains and losses. There is a very high degree of risk involved in trading. The technical analysis, like any and all indicators, strategies, columns, articles and other features accessible on/though this site (including those from Signal Centre) are for informational purposes only and should not be construed as investment advice by you. Such technical analysis are believed to be obtained from sources believed to be reliable, but not warrant their respective completeness or accuracy, or warrant any results from the use of the information. Your use of the technical analysis, as would also your use of any and all mentioned indicators, strategies, columns, articles and all other features, is entirely at your own risk and it is your sole responsibility to evaluate the accuracy, completeness and usefulness (including suitability) of the information. You should assess the risk of any trade with your financial adviser and make your own independent decision(s) regarding any tradable products which may be the subject matter of the technical analysis or any of the said indicators, strategies, columns, articles and all other features.
Please also be reminded that if despite the above, any of the said technical analysis (or any of the said indicators, strategies, columns, articles and other features accessible on/through this site) is found to be advisory or a recommendation; and not merely informational in nature, the same is in any event provided with the intention of being for general circulation and availability only. As such it is not intended to and does not form part of any offer or recommendation directed at you specifically, or have any regard to the investment objectives, financial situation or needs of yourself or any other specific person. Before committing to a trade or investment therefore, please seek advice from a financial or other professional adviser regarding the suitability of the product for you and (where available) read the relevant product offer/description documents, including the risk disclosures. If you do not wish to seek such financial advice, please still exercise your mind and consider carefully whether the product is suitable for you because you alone remain responsible for your trading – both gains and losses.

1/9/22 BRK.B Berkshire Hathaway Inc. New ( NYSE:BRK.B )
Sector: Finance (Multi-Line Insurance)
Market Capitalization: 714.396B
Current Price: $319.78
Breakout price: $301.50 (hold above)
Buy Zone (Top/Bottom Range): $305.00-$296.75
Price Target: $329.00-$334.50
Estimated Duration to Target: 100-106d
Contract of Interest: $BRKB 6/17/22 345c
Trade price as of publish date: $6.60/contract

Major Top for BRK.BAbout every decade BRK.B has a major top. Drawing a fib from the Dot.com correction in 1999 the 2.618 called the top of the Great Financial Crisis in 2007, and the 4.414 called the next major top in 2014. Drawing a fib from the GFC the 2 was almost hit during the top in 2014, and 4.414 called $294 as the next decade's cycle top, which has been rejected twice this year. The four major tops are actually spaced apart by about seven years (1999, 2007, 2014, 2021).
The daily chart has formed a triple top over the past six months. Two shooting star candles confirmed that $294 is seemingly insurmountable resistance, the first on May 10 and the second on November 8. Although this may continue to consolidate for months or longer, the upside is very limited, the opportunity cost is high, and an eventual correction can be expected.

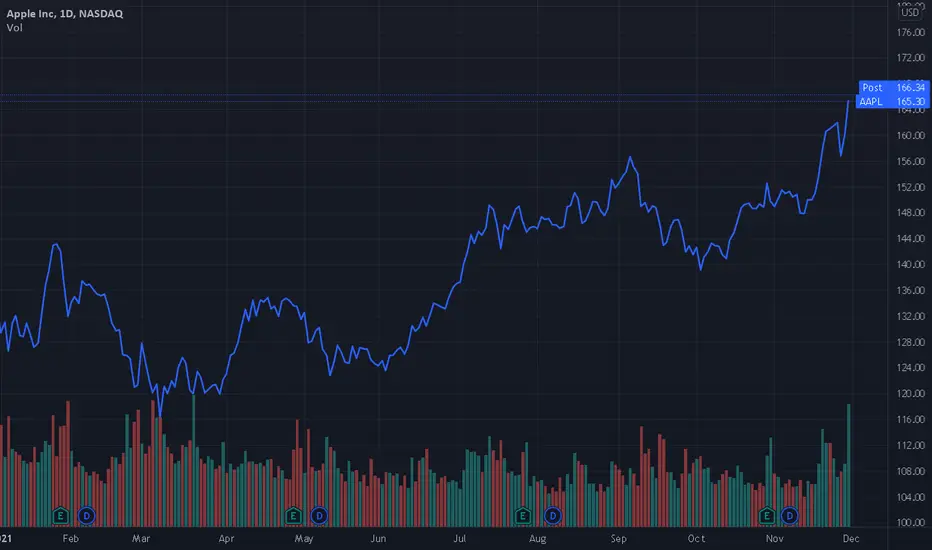
Apple and the price climbOnce again I'm investigating the financial condition and potential performance of a tech company as they do hold great interest to me. Today, I'm taking a look at NASDAQ:AAPL , a company I once despised for their obscene operating scheme. Where 85% of their business was through reputation, the idea that a person is only cool if they have the latest iPhone and a Macbook and the other 15% was through corporate deals and actual entertainment production professionals.
After doing some investigation into the company, I've come to realise quite a number of interesting things that shoot all my prior grudges with them straight out of the sky. First of all, looking within the market itself, their obscene prices are no longer that astronomical and are actually practical and reasonable given the current technology market and second, when they claim to cater for professionals and a particular minimalist "ease-of-use" customer, they're actually covering their needs now. With the development of the new M1 chip and hopefully the M2 soon to come and the development of the new iPads and Mac Minis, the company's physical product is appearing very attractive.
Now to the actual financial side of things, starting off with the most basic of indicators, Apple has considerably low debts in comparison to other tech giants and their respective growth rates and as far as their current P/E ratio is considered they're showing more hope than any other technology giant with a PE just less than 30 (28.58 at time of writing). Within the market competitors are looking at frightening volumes of debt due to the Corona Virus pandemic but Apple seems to stay relatively clear. This would probably explain why Warren Buffett has poured such large volumes of Berkshire Hathaway's money into the company. Ironically, since BRK's interest in Apple, their prospects seem to have changed for the better and future expected growth in earning's increased by more than 4 percentage points after BRK's investment. As we all know Mr. Buffet wouldn't pour money into a company if he did not believe their long term results were unsatisfactory.
In conclusion, Apple is beginning to look like quite the appealing investment if an investor would like to uplift their tech side of their portfolio. If anybody has any other opinions or facts that I may not be aware of, feel free to comment. I always appreciate the exchange of ideas :D
TL;DR: Apple is beginning to look like one of the best performing long term investments of all the tech giants.
BRK.B - STOCKS - 11. OCT. 2021Welcome to our Weekly V2-Trade Setup ( BRK.B ) !
-
4 HOUR
Bullish market open..
DAILY
Expecting more buyers shortly..
WEEKLY
Market about to turn in my view.
-
STOCK SETUP
BUY BRK.B
ENTRY LEVEL @ 285.25
SL @ 272.86
TP @ Open
Max Risk: 0.5% - 1%!
(Remember to add a few pips to all levels - different Brokers!)
Leave us a comment or like to keep our content for free and alive.
Have a great week everyone!
ALAN

StoneCo (STNE) | Warren Buffet Stock To BUY!Hi,
StoneCo is one of them that is on the Berkshire Hatheway list. Warren Buffett's advice to be "fearful when others are greedy and greedy when others are fearful" is probably one of the world's most famous and frequently repeated investing quotes. Considering that, STNE looks promising.
StoneCo is a leading provider of payment-processing and other financial technology services in Brazil, but the company's share price has been crushed by what could be described as a perfect storm of headwinds. In addition to inflation and political concerns, regulatory changes in the country have dampened the performance and outlook for the company's credit business.
The company's share price is now down roughly 67% from the high that it hit earlier this year, and many investors appear to have given up on the stock. I think that's probably premature, and I'll be adding it to my holdings in the near future.
When it comes to growth stocks, I like to look for companies that are on track to benefit from powerful long-term trends. StoneCo certainly fits the bill. Cash is still a more popular payment method than credit cards and mobile payments in Brazil, but that's starting to change, and StoneCo is helping businesses adapt to the shift. E-commerce is also on track for huge growth in Brazil and other Latin American markets, and the fintech specialist stands out as an appealing "pick and shovel" stock for benefiting from the trend.
While the overall stock market continues to look volatile, StoneCo looks attractively valued and has big upside at current prices. Pushing through the fear surrounding the stock could prove very rewarding for patient investors.
Considering long-term goals and considering that it is technically inside a quite strong buying zone I can recommend it here as an idea for you.
Do your own research!
Regards,
Vaido
